Home
Understanding the Electrocardiogram

Main navigation

  • Home
  • Understanding ECGs
    • Introduction
User account menu
  • Log in

Breadcrumb

  1. Home
  2. Understanding the Electrocardiogram In Health & Disease
  3. 2.0.0 The Normal Electrocardiogram
  4. 2.3.0 QRS Complex

2.3.46

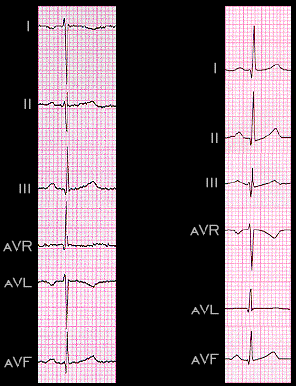
In patients with dextrocardia, the ECG will appear abnormal when recorded with the leads placed in their normal position because the relationship normally present between the leads and the heart will not be present. Reversing the arm leads and placing the precordial leads on the right side of the chest will restore the normal relationship and correct the ECG abnormalities. The six frontal plane leads shown here are from the same patient with dextrocardia that was shown earlier (pages 2.1.30 - 2.1.32). The ECG on the left was recorded with the leads placed in their normal position. It appears as if the arm leads had been reversed. The ECG on the right was recorded after the arm leads were reversed and now appears normal.

Book traversal links for 2.3.46

  • 2.3.45
  • Up
  • 2.3.47

Site is under construction

Book navigation

  • Introduction to First Edition
  • 1.0.0 Generation of the ECG
  • 2.0.0 The Normal Electrocardiogram
    • 2.1.0 P Wave
    • 2.2.0 PR Interval
    • 2.3.0 QRS Complex
      • 2.3.1
      • 2.3.2
      • 2.3.3
      • 2.3.4
      • 2.3.5
      • 2.3.6
      • 2.3.7
      • 2.3.8
      • 2.3.9
      • 2.3.10
      • 2.3.11
      • 2.3.12
      • 2.3.13
      • 2.3.14
      • 2.3.15
      • 2.3.16
      • 2.3.17
      • 2.3.18
      • 2.3.19
      • 2.3.20
      • 2.3.21
      • 2.3.22
      • 2.3.23
      • 2.3.24
      • 2.3.25
      • 2.3.26
      • 2.3.27
      • 2.3.28
      • 2.3.29
      • 2.3.30
      • 2.3.31
      • 2.3.32
      • 2.3.33
      • 2.3.34
      • 2.3.35
      • 2.3.36
      • 2.3.37
      • 2.3.38
      • 2.3.39
      • 2.3.40
      • 2.3.41
      • 2.3.42
      • 2.3.43
      • 2.3.44
      • 2.3.45
      • 2.3.46
      • 2.3.47
    • 2.4.0 ST segment
    • 2.5.0 T wave
    • 2.6.0 QT Interval
    • 2.7.0 U Wave
  • 3.0.0 Inter and intra-ventricular Conduction Disturbances
  • 4.0.0 Ventricular Hypertrophy
  • 5.0.0 ELECTROLYTE ABNORMALITIES, DRUG EFFECTS AND THE LONG QT SYNDROMES
  • 6.0.0 Ischemia and Infarction - Introduction (frame i and ii)
  • 7.0.0 Tachycardias- Introduction
  • 8.0.0 The Bradycardias frame i-introduction
  • 9.0.0 The ECG of Heart Murmurs-introduction
  • 10.0.0 The Electrocardiogram in the Emergency Department-Introduction
Powered by Drupal