Home
Understanding the Electrocardiogram

Main navigation

  • Home
  • Understanding ECGs
    • Introduction
User account menu
  • Log in

Breadcrumb

  1. Home
  2. Understanding the Electrocardiogram In Health & Disease
  3. 2.0.0 The Normal Electrocardiogram
  4. 2.3.0 QRS Complex

2.3.21

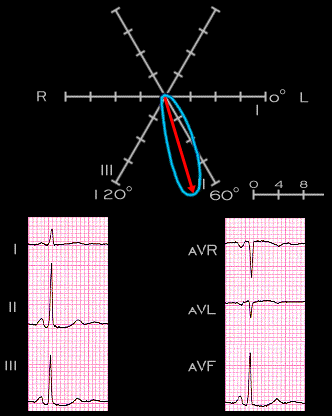
The vector loop associated with this QRS complex is narrower and more vertically oriented than that shown in the preceding example.

Book traversal links for 2.3.21

  • 2.3.20
  • Up
  • 2.3.22

Site is under construction

Book navigation

  • Introduction to First Edition
  • 1.0.0 Generation of the ECG
  • 2.0.0 The Normal Electrocardiogram
    • 2.1.0 P Wave
    • 2.2.0 PR Interval
    • 2.3.0 QRS Complex
      • 2.3.1
      • 2.3.2
      • 2.3.3
      • 2.3.4
      • 2.3.5
      • 2.3.6
      • 2.3.7
      • 2.3.8
      • 2.3.9
      • 2.3.10
      • 2.3.11
      • 2.3.12
      • 2.3.13
      • 2.3.14
      • 2.3.15
      • 2.3.16
      • 2.3.17
      • 2.3.18
      • 2.3.19
      • 2.3.20
      • 2.3.21
      • 2.3.22
      • 2.3.23
      • 2.3.24
      • 2.3.25
      • 2.3.26
      • 2.3.27
      • 2.3.28
      • 2.3.29
      • 2.3.30
      • 2.3.31
      • 2.3.32
      • 2.3.33
      • 2.3.34
      • 2.3.35
      • 2.3.36
      • 2.3.37
      • 2.3.38
      • 2.3.39
      • 2.3.40
      • 2.3.41
      • 2.3.42
      • 2.3.43
      • 2.3.44
      • 2.3.45
      • 2.3.46
      • 2.3.47
    • 2.4.0 ST segment
    • 2.5.0 T wave
    • 2.6.0 QT Interval
    • 2.7.0 U Wave
  • 3.0.0 Inter and intra-ventricular Conduction Disturbances
  • 4.0.0 Ventricular Hypertrophy
  • 5.0.0 ELECTROLYTE ABNORMALITIES, DRUG EFFECTS AND THE LONG QT SYNDROMES
  • 6.0.0 Ischemia and Infarction - Introduction (frame i and ii)
  • 7.0.0 Tachycardias- Introduction
  • 8.0.0 The Bradycardias frame i-introduction
  • 9.0.0 The ECG of Heart Murmurs-introduction
  • 10.0.0 The Electrocardiogram in the Emergency Department-Introduction
Powered by Drupal