
The amplitude of the S wave in leads V1 and V2 can range normally from as low as 2 mm (0.2 mV) to more than 25 mm (2.5mV) while the amplitude of the R wave in leads V5 and V6 can range normally from 3 mm (0.3 mV) to 25 mm (2.5 mV). These wide ranges are explained, in large part, by the factors listed on the previous page.
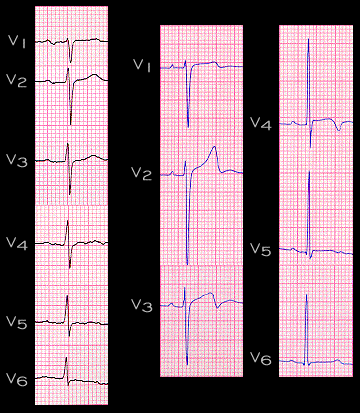
The six chest leads shown on the left of this figure are from a 61 year old obese male. Note that the S wave in V1 has an amplitude of 5 mm (0.5 mV) and that the R wave in V6 is also 5 mm (0.5 mV) in amplitude. The six chest leads shown in the 2 columns on the right are from a 21 year old lean male and reveal an S wave in lead V2 of 25 mm (2.5 mV) and an R wave in V5 that has an amplitude of 23 mm (2.3 mV). Although there are T wave abnormalities in both tracings which will be discussed later, the R and S wave amplitudes in both are still within normal limits.