Home
Understanding the Electrocardiogram

Main navigation

  • Home
  • Understanding ECGs
    • Introduction
User account menu
  • Log in

Breadcrumb

  1. Home
  2. Understanding the Electrocardiogram In Health & Disease
  3. 2.0.0 The Normal Electrocardiogram

2.7.0 U Wave

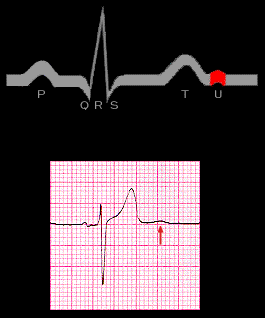
The U wave (arrow) occurs within or immediately after the T wave. It is a low amplitude upright (or positive) wave with a duration of 100 to 200 ms that is best seen in the mid-precordial leads (leads V3 and V4). It is frequently not visible in the limb leads. The U wave becomes more obvious at slower rates. Indeed,  at rates above 100/min, it may not be discernible in any lead. The etiology of the U wave is unclear. It has been suggested that it may relate to ventricular or Purkinje fiber repolarization. However, the most favored  hypothesis is that it is a mechano-electrical event linked to ventricular relaxation.

  • 2.7.1
  • 2.7.2
  • 2.7.3

Book traversal links for 2.7.0 U Wave

  • 2.6.2
  • Up
  • 2.7.1

Site is under construction

Book navigation

  • Introduction to First Edition
  • 1.0.0 Generation of the ECG
  • 2.0.0 The Normal Electrocardiogram
    • 2.1.0 P Wave
    • 2.2.0 PR Interval
    • 2.3.0 QRS Complex
    • 2.4.0 ST segment
    • 2.5.0 T wave
    • 2.6.0 QT Interval
    • 2.7.0 U Wave
      • 2.7.1
      • 2.7.2
      • 2.7.3
  • 3.0.0 Inter and intra-ventricular Conduction Disturbances
  • 4.0.0 Ventricular Hypertrophy
  • 5.0.0 ELECTROLYTE ABNORMALITIES, DRUG EFFECTS AND THE LONG QT SYNDROMES
  • 6.0.0 Ischemia and Infarction - Introduction (frame i and ii)
  • 7.0.0 Tachycardias- Introduction
  • 8.0.0 The Bradycardias frame i-introduction
  • 9.0.0 The ECG of Heart Murmurs-introduction
  • 10.0.0 The Electrocardiogram in the Emergency Department-Introduction
Powered by Drupal