Home
Understanding the Electrocardiogram

Main navigation

  • Home
  • Understanding ECGs
    • Introduction
User account menu
  • Log in

Breadcrumb

  1. Home
  2. Understanding the Electrocardiogram In Health & Disease
  3. 2.0.0 The Normal Electrocardiogram

2.5.0 T wave

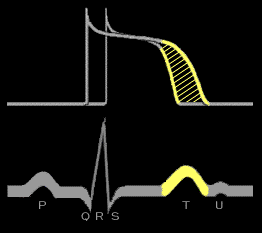
As discussed earlier , the T wave on the body surface electrocardiogram reflects the unopposed electrical forces that occur when the ventricular cells sequentially repolarize. These unopposed electrical forces result in an electrical vector that has a magnitude and direction, just as the unopposed electrical forces that occur during atrial and ventricular depolarization and cause the P wave and QRS complex have a magnitude and direction.

  • 2.5.1
  • 2.5.2
  • 2.5.3
  • 2.5.4
  • 2.5.5
  • 2.5.6
  • 2.5.7
  • 2.5.8
  • 2.5.9
  • 2.5.10
  • 2.5.11
  • 2.5.12
  • 2.5.13

Book traversal links for 2.5.0 T wave

  • 2.4.3
  • Up
  • 2.5.1

Site is under construction

Book navigation

  • Introduction to First Edition
  • 1.0.0 Generation of the ECG
  • 2.0.0 The Normal Electrocardiogram
    • 2.1.0 P Wave
    • 2.2.0 PR Interval
    • 2.3.0 QRS Complex
    • 2.4.0 ST segment
    • 2.5.0 T wave
      • 2.5.1
      • 2.5.2
      • 2.5.3
      • 2.5.4
      • 2.5.5
      • 2.5.6
      • 2.5.7
      • 2.5.8
      • 2.5.9
      • 2.5.10
      • 2.5.11
      • 2.5.12
      • 2.5.13
    • 2.6.0 QT Interval
    • 2.7.0 U Wave
  • 3.0.0 Inter and intra-ventricular Conduction Disturbances
  • 4.0.0 Ventricular Hypertrophy
  • 5.0.0 ELECTROLYTE ABNORMALITIES, DRUG EFFECTS AND THE LONG QT SYNDROMES
  • 6.0.0 Ischemia and Infarction - Introduction (frame i and ii)
  • 7.0.0 Tachycardias- Introduction
  • 8.0.0 The Bradycardias frame i-introduction
  • 9.0.0 The ECG of Heart Murmurs-introduction
  • 10.0.0 The Electrocardiogram in the Emergency Department-Introduction
Powered by Drupal