Home
Understanding the Electrocardiogram

Main navigation

  • Home
  • Understanding ECGs
    • Introduction
User account menu
  • Log in

Breadcrumb

  1. Home
  2. Understanding the Electrocardiogram In Health & Disease
  3. 2.0.0 The Normal Electrocardiogram
  4. 2.3.0 QRS Complex

2.3.36

The amplitudes of the R and S waves in the V leads depend on multiple factors and are therefore highly variable. Some of these factors are listed here.

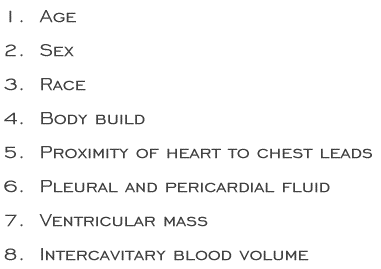
The first five are independent of any abnormality or disease and apply to all individuals. For instance, R and S wave amplitudes are greater in younger individuals, in males, in those of African descent, in those with lean body builds and in those in whom the heart is in close proximity to the chest leads. The last 3 factors are associated with cardiac abnormalities or with fluid in the various spaces between the heart and the chest wall. An increase in ventricular mass connotes hypertrophy, and an increase in intercavitary blood volume implies ventricular dilatation

Book traversal links for 2.3.36

  • 2.3.35
  • Up
  • 2.3.37

Site is under construction

Book navigation

  • Introduction to First Edition
  • 1.0.0 Generation of the ECG
  • 2.0.0 The Normal Electrocardiogram
    • 2.1.0 P Wave
    • 2.2.0 PR Interval
    • 2.3.0 QRS Complex
      • 2.3.1
      • 2.3.2
      • 2.3.3
      • 2.3.4
      • 2.3.5
      • 2.3.6
      • 2.3.7
      • 2.3.8
      • 2.3.9
      • 2.3.10
      • 2.3.11
      • 2.3.12
      • 2.3.13
      • 2.3.14
      • 2.3.15
      • 2.3.16
      • 2.3.17
      • 2.3.18
      • 2.3.19
      • 2.3.20
      • 2.3.21
      • 2.3.22
      • 2.3.23
      • 2.3.24
      • 2.3.25
      • 2.3.26
      • 2.3.27
      • 2.3.28
      • 2.3.29
      • 2.3.30
      • 2.3.31
      • 2.3.32
      • 2.3.33
      • 2.3.34
      • 2.3.35
      • 2.3.36
      • 2.3.37
      • 2.3.38
      • 2.3.39
      • 2.3.40
      • 2.3.41
      • 2.3.42
      • 2.3.43
      • 2.3.44
      • 2.3.45
      • 2.3.46
      • 2.3.47
    • 2.4.0 ST segment
    • 2.5.0 T wave
    • 2.6.0 QT Interval
    • 2.7.0 U Wave
  • 3.0.0 Inter and intra-ventricular Conduction Disturbances
  • 4.0.0 Ventricular Hypertrophy
  • 5.0.0 ELECTROLYTE ABNORMALITIES, DRUG EFFECTS AND THE LONG QT SYNDROMES
  • 6.0.0 Ischemia and Infarction - Introduction (frame i and ii)
  • 7.0.0 Tachycardias- Introduction
  • 8.0.0 The Bradycardias frame i-introduction
  • 9.0.0 The ECG of Heart Murmurs-introduction
  • 10.0.0 The Electrocardiogram in the Emergency Department-Introduction
Powered by Drupal