Home
Understanding the Electrocardiogram

Main navigation

  • Home
  • Understanding ECGs
    • Introduction
User account menu
  • Log in

Breadcrumb

  1. Home
  2. Understanding the Electrocardiogram In Health & Disease
  3. 2.0.0 The Normal Electrocardiogram
  4. 2.3.0 QRS Complex

2.3.22

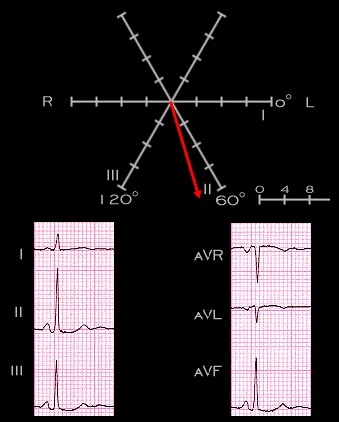
A rapid way to identify the main (and mean) electrical axis is to identify the leads having the greatest QRS net amplitude since the axis will be most nearly parallel to these leads. In this example, the QRS complex is positive in leads I,II, III and aVF and of greatest amplitude in leads II and aVF. This localizes the axis to somewhere between and on the positive side of these two leads. It is of greater amplitude in lead II than  in lead aVF and therfore  more parallel and  closer to the lead II positive axis than to the positive axis of lead aVF.  The smallest QRS amplitude is in lead I, indicating that the electrical axis is closest to perpendicular to this lead but still on the positive side. Thus, by "eye-balling" the QRS complex, it is possible to predict the electrical axis in the frontal plane with reasonable accuracy.

Book traversal links for 2.3.22

  • 2.3.21
  • Up
  • 2.3.23

Site is under construction

Book navigation

  • Introduction to First Edition
  • 1.0.0 Generation of the ECG
  • 2.0.0 The Normal Electrocardiogram
    • 2.1.0 P Wave
    • 2.2.0 PR Interval
    • 2.3.0 QRS Complex
      • 2.3.1
      • 2.3.2
      • 2.3.3
      • 2.3.4
      • 2.3.5
      • 2.3.6
      • 2.3.7
      • 2.3.8
      • 2.3.9
      • 2.3.10
      • 2.3.11
      • 2.3.12
      • 2.3.13
      • 2.3.14
      • 2.3.15
      • 2.3.16
      • 2.3.17
      • 2.3.18
      • 2.3.19
      • 2.3.20
      • 2.3.21
      • 2.3.22
      • 2.3.23
      • 2.3.24
      • 2.3.25
      • 2.3.26
      • 2.3.27
      • 2.3.28
      • 2.3.29
      • 2.3.30
      • 2.3.31
      • 2.3.32
      • 2.3.33
      • 2.3.34
      • 2.3.35
      • 2.3.36
      • 2.3.37
      • 2.3.38
      • 2.3.39
      • 2.3.40
      • 2.3.41
      • 2.3.42
      • 2.3.43
      • 2.3.44
      • 2.3.45
      • 2.3.46
      • 2.3.47
    • 2.4.0 ST segment
    • 2.5.0 T wave
    • 2.6.0 QT Interval
    • 2.7.0 U Wave
  • 3.0.0 Inter and intra-ventricular Conduction Disturbances
  • 4.0.0 Ventricular Hypertrophy
  • 5.0.0 ELECTROLYTE ABNORMALITIES, DRUG EFFECTS AND THE LONG QT SYNDROMES
  • 6.0.0 Ischemia and Infarction - Introduction (frame i and ii)
  • 7.0.0 Tachycardias- Introduction
  • 8.0.0 The Bradycardias frame i-introduction
  • 9.0.0 The ECG of Heart Murmurs-introduction
  • 10.0.0 The Electrocardiogram in the Emergency Department-Introduction
Powered by Drupal