
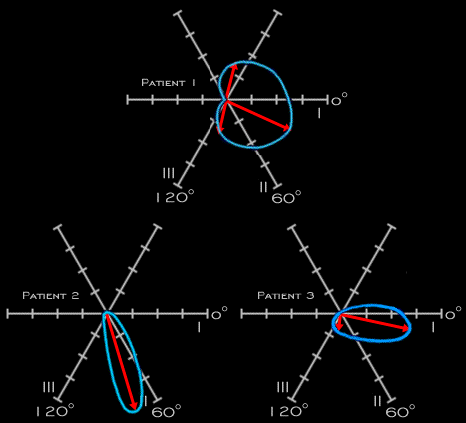
The QRS complexes from each of the 3 ECGs are shown here. Note that each has a different waveform and a different electrical axis even though all are normal. Note also that the initial component, representing septal depolarization, is more obvious in the first example than in the other two. Indeed, in the second example, it is impossible to identify a discrete initial component.