Home
Understanding the Electrocardiogram

Main navigation

  • Home
  • Understanding ECGs
    • Introduction
User account menu
  • Log in

Breadcrumb

  1. Home
  2. Understanding the Electrocardiogram In Health & Disease
  3. 2.0.0 The Normal Electrocardiogram
  4. 2.3.0 QRS Complex

2.3.42

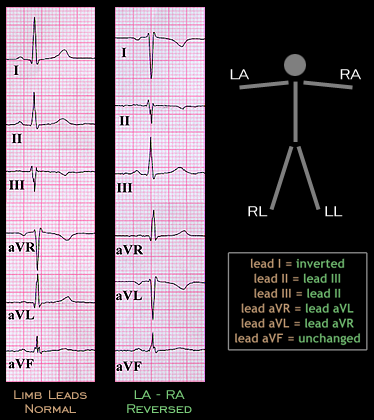
Earlier in this chapter (page 2.1.29), the effect of reversing the placement of the left and right arm leads on the P wave was discussed. Applying the limb leads incorrectly will also effect the waveform of the QRS complex and the T wave. The effect of incorrect lead placement is shown in this and in the next three pages. In each, two recordings of the six limb leads (leads I, II, III, aVR aVL, and aVF) are shown, The tracing on the left is recorded with the leads correctly placed. The tracing on the right is recorded with the leads placed incorrectly. On this page, the arm leads are reversed as on page 2.1.29. Lead 1 is inverted because the left arm is now the negative pole and the right arm is now the positive pole. Lead 2 is now recorded between the left arm and the left leg and is therefore the normal lead III and lead III is now the normal lead II. Leads aVR and aVL are reversed while aVF is unchanged.

Book traversal links for 2.3.42

  • 2.3.41
  • Up
  • 2.3.43

Site is under construction

Book navigation

  • Introduction to First Edition
  • 1.0.0 Generation of the ECG
  • 2.0.0 The Normal Electrocardiogram
    • 2.1.0 P Wave
    • 2.2.0 PR Interval
    • 2.3.0 QRS Complex
      • 2.3.1
      • 2.3.2
      • 2.3.3
      • 2.3.4
      • 2.3.5
      • 2.3.6
      • 2.3.7
      • 2.3.8
      • 2.3.9
      • 2.3.10
      • 2.3.11
      • 2.3.12
      • 2.3.13
      • 2.3.14
      • 2.3.15
      • 2.3.16
      • 2.3.17
      • 2.3.18
      • 2.3.19
      • 2.3.20
      • 2.3.21
      • 2.3.22
      • 2.3.23
      • 2.3.24
      • 2.3.25
      • 2.3.26
      • 2.3.27
      • 2.3.28
      • 2.3.29
      • 2.3.30
      • 2.3.31
      • 2.3.32
      • 2.3.33
      • 2.3.34
      • 2.3.35
      • 2.3.36
      • 2.3.37
      • 2.3.38
      • 2.3.39
      • 2.3.40
      • 2.3.41
      • 2.3.42
      • 2.3.43
      • 2.3.44
      • 2.3.45
      • 2.3.46
      • 2.3.47
    • 2.4.0 ST segment
    • 2.5.0 T wave
    • 2.6.0 QT Interval
    • 2.7.0 U Wave
  • 3.0.0 Inter and intra-ventricular Conduction Disturbances
  • 4.0.0 Ventricular Hypertrophy
  • 5.0.0 ELECTROLYTE ABNORMALITIES, DRUG EFFECTS AND THE LONG QT SYNDROMES
  • 6.0.0 Ischemia and Infarction - Introduction (frame i and ii)
  • 7.0.0 Tachycardias- Introduction
  • 8.0.0 The Bradycardias frame i-introduction
  • 9.0.0 The ECG of Heart Murmurs-introduction
  • 10.0.0 The Electrocardiogram in the Emergency Department-Introduction
Powered by Drupal