Home
Understanding the Electrocardiogram

Main navigation

  • Home
  • Understanding ECGs
    • Introduction
User account menu
  • Log in

Breadcrumb

  1. Home
  2. Understanding the Electrocardiogram In Health & Disease
  3. 2.0.0 The Normal Electrocardiogram
  4. 2.1.0 P Wave

2.1.28

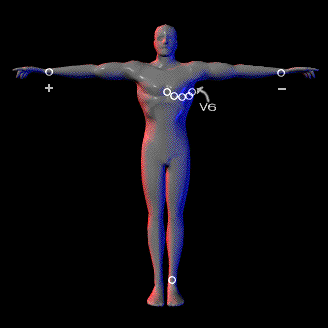
In the example shown here, the arm leads are reversed. The lead placed on the right arm is now the positive lead and the lead placed on the left arm is now negative

Book traversal links for 2.1.28

  • 2.1.27
  • Up
  • 2.1.29

Site is under construction

Book navigation

  • Introduction to First Edition
  • 1.0.0 Generation of the ECG
  • 2.0.0 The Normal Electrocardiogram
    • 2.1.0 P Wave
      • 2.1.1
      • 2.1.2
      • 2.1.3
      • 2.1.4
      • 2.1.5
      • 2.1.6
      • 2.1.7
      • 2.1.8
      • 2.1.9
      • 2.1.10
      • 2.1.11
      • 2.1.12
      • 2.1.13
      • 2.1.14
      • 2.1.15
      • 2.1.16
      • 2.1.17
      • 2.1.18
      • 2.1.19
      • 2.1.20
      • 2.1.21
      • 2.1.22
      • 2.1.23
      • 2.1.24
      • 2.1.25
      • 2.1.26
      • 2.1.27
      • 2.1.28
      • 2.1.29
      • 2.1.30
      • 2.1.31
      • 2.1.32
      • 2.1.33
    • 2.2.0 PR Interval
    • 2.3.0 QRS Complex
    • 2.4.0 ST segment
    • 2.5.0 T wave
    • 2.6.0 QT Interval
    • 2.7.0 U Wave
  • 3.0.0 Inter and intra-ventricular Conduction Disturbances
  • 4.0.0 Ventricular Hypertrophy
  • 5.0.0 ELECTROLYTE ABNORMALITIES, DRUG EFFECTS AND THE LONG QT SYNDROMES
  • 6.0.0 Ischemia and Infarction - Introduction (frame i and ii)
  • 7.0.0 Tachycardias- Introduction
  • 8.0.0 The Bradycardias frame i-introduction
  • 9.0.0 The ECG of Heart Murmurs-introduction
  • 10.0.0 The Electrocardiogram in the Emergency Department-Introduction
Powered by Drupal