
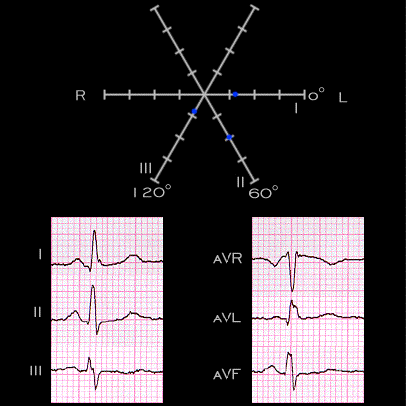
This electrocardiogram shows the frontal plane leads (leads I, II, III, aVR, aVL and aVF) from a 47 year old female and illustrates the normal P wave. Note that the P wave is positive in leads I and aVL, and negative in aVR. This reflects its leftward orientation. It is also positive in leads II, III, and aVF. This reflects its inferior orientation. The electrical axis of this P wave can be determined by plotting its values in the various leads on the triaxial template. As shown by the blue dots, the P wave amplitude is a little over 1 mm in lead I, a little less than 1 mm in lead III, and 2 mm in amplitude in lead II. Note again that the sum of the P wave amplitudes in leads I and III equals its amplitude in lead II, i.e. lead I + lead III = lead II (Kirkoff's Law).