Home
Understanding the Electrocardiogram

Main navigation

  • Home
  • Understanding ECGs
    • Introduction
User account menu
  • Log in

Breadcrumb

  1. Home
  2. Understanding the Electrocardiogram In Health & Disease
  3. 2.0.0 The Normal Electrocardiogram
  4. 2.1.0 P Wave

2.1.15

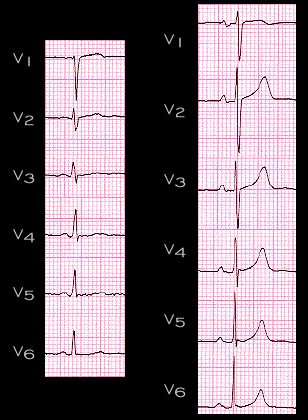
The chest leads from the other two patients whose frontal plane leads were shown earlier (pages 2.1.7 and 2.1.9) are shown here. They also demonstrate the characteristics of the normal P wave. The P wave is of lower amplitude in the ECG on the left than on the right, but in both, the biphasic nature of the P wave is seen in leads V1 and V2 and the progressive positivity is noted in leads V3 to V6.

Book traversal links for 2.1.15

  • 2.1.14
  • Up
  • 2.1.16

Site is under construction

Book navigation

  • Introduction to First Edition
  • 1.0.0 Generation of the ECG
  • 2.0.0 The Normal Electrocardiogram
    • 2.1.0 P Wave
      • 2.1.1
      • 2.1.2
      • 2.1.3
      • 2.1.4
      • 2.1.5
      • 2.1.6
      • 2.1.7
      • 2.1.8
      • 2.1.9
      • 2.1.10
      • 2.1.11
      • 2.1.12
      • 2.1.13
      • 2.1.14
      • 2.1.15
      • 2.1.16
      • 2.1.17
      • 2.1.18
      • 2.1.19
      • 2.1.20
      • 2.1.21
      • 2.1.22
      • 2.1.23
      • 2.1.24
      • 2.1.25
      • 2.1.26
      • 2.1.27
      • 2.1.28
      • 2.1.29
      • 2.1.30
      • 2.1.31
      • 2.1.32
      • 2.1.33
    • 2.2.0 PR Interval
    • 2.3.0 QRS Complex
    • 2.4.0 ST segment
    • 2.5.0 T wave
    • 2.6.0 QT Interval
    • 2.7.0 U Wave
  • 3.0.0 Inter and intra-ventricular Conduction Disturbances
  • 4.0.0 Ventricular Hypertrophy
  • 5.0.0 ELECTROLYTE ABNORMALITIES, DRUG EFFECTS AND THE LONG QT SYNDROMES
  • 6.0.0 Ischemia and Infarction - Introduction (frame i and ii)
  • 7.0.0 Tachycardias- Introduction
  • 8.0.0 The Bradycardias frame i-introduction
  • 9.0.0 The ECG of Heart Murmurs-introduction
  • 10.0.0 The Electrocardiogram in the Emergency Department-Introduction
Powered by Drupal