Home
Understanding the Electrocardiogram

Main navigation

  • Home
  • Understanding ECGs
    • Introduction
User account menu
  • Log in

Breadcrumb

  1. Home
  2. Understanding the Electrocardiogram In Health & Disease
  3. 2.0.0 The Normal Electrocardiogram
  4. 2.1.0 P Wave

2.1.19

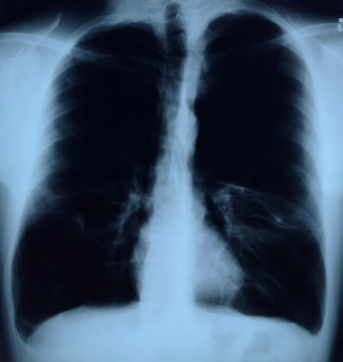
This P wave configuration is often interpreted as indicating right atrial enlargement or hypertrophy and this may be a contributing factor. More likely, however, it reflects the vertical position of the heart which occurs because the diaphragms in patients with severe obstructive airway disease are characteristically depressed and flattened. The posterior-anterior (PA) chest x-ray shown here is from such a patient.

Book traversal links for 2.1.19

  • 2.1.18
  • Up
  • 2.1.20

Site is under construction

Book navigation

  • Introduction to First Edition
  • 1.0.0 Generation of the ECG
  • 2.0.0 The Normal Electrocardiogram
    • 2.1.0 P Wave
      • 2.1.1
      • 2.1.2
      • 2.1.3
      • 2.1.4
      • 2.1.5
      • 2.1.6
      • 2.1.7
      • 2.1.8
      • 2.1.9
      • 2.1.10
      • 2.1.11
      • 2.1.12
      • 2.1.13
      • 2.1.14
      • 2.1.15
      • 2.1.16
      • 2.1.17
      • 2.1.18
      • 2.1.19
      • 2.1.20
      • 2.1.21
      • 2.1.22
      • 2.1.23
      • 2.1.24
      • 2.1.25
      • 2.1.26
      • 2.1.27
      • 2.1.28
      • 2.1.29
      • 2.1.30
      • 2.1.31
      • 2.1.32
      • 2.1.33
    • 2.2.0 PR Interval
    • 2.3.0 QRS Complex
    • 2.4.0 ST segment
    • 2.5.0 T wave
    • 2.6.0 QT Interval
    • 2.7.0 U Wave
  • 3.0.0 Inter and intra-ventricular Conduction Disturbances
  • 4.0.0 Ventricular Hypertrophy
  • 5.0.0 ELECTROLYTE ABNORMALITIES, DRUG EFFECTS AND THE LONG QT SYNDROMES
  • 6.0.0 Ischemia and Infarction - Introduction (frame i and ii)
  • 7.0.0 Tachycardias- Introduction
  • 8.0.0 The Bradycardias frame i-introduction
  • 9.0.0 The ECG of Heart Murmurs-introduction
  • 10.0.0 The Electrocardiogram in the Emergency Department-Introduction
Powered by Drupal