Home
Understanding the Electrocardiogram

Main navigation

  • Home
  • Understanding ECGs
    • Introduction
User account menu
  • Log in

Breadcrumb

  1. Home
  2. Understanding the Electrocardiogram In Health & Disease
  3. 4.0.0 Ventricular Hypertrophy
  4. 4.2.0 Right Ventricular Hypertrophy (frame 21)

4.2.17 (frame 44 again

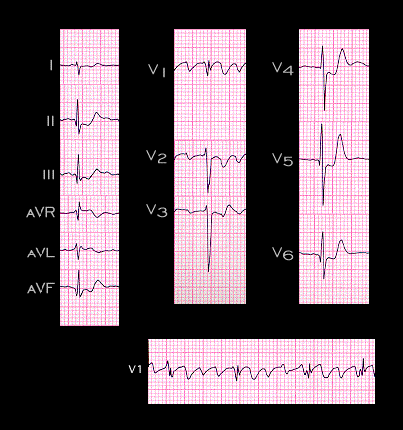
The tracing shows atrial fibrillation, right axis deviation, and an S wave in leads I, V5 and V6 that is of greater amplitude than the S wave in V1. The tracing suggests right ventricular hypertrophy in the setting of atrial fibrillation and is consistent with a diagnosis of mitral stenosis. But, in this patient, the diagnosis was a left atrial myxoma which was obstructing the mitral valve. Note that there is also ST depression seen best in leads II, V4-6. This is due to digitalis which was being administered because of the atrial fibrillation.

Book traversal links for 4.2.17 (frame 44 again

  • 4.2.16 (frame 44
  • Up
  • 4.2.18 (frame 45

Site is under construction

Book navigation

  • Introduction to First Edition
  • 1.0.0 Generation of the ECG
  • 2.0.0 The Normal Electrocardiogram
  • 3.0.0 Inter and intra-ventricular Conduction Disturbances
  • 4.0.0 Ventricular Hypertrophy
    • 4.1.0 Left Ventricular Hypertrophy (frame 1)
    • 4.2.0 Right Ventricular Hypertrophy (frame 21)
      • 4.2.1 (frame 22)
      • 4.2.2 (frame 23)
      • 4.2.3 (frame 24
      • 4.2.4 (frame25)
      • 4.2.5 (frame 27 26 intentionally omitted)
      • 4.2.6(frame 29 frame 28 intentionally omitted)
      • 4.2.8 (frame 31)
      • 4.2.9 (frame 32)
      • 4.2.10(frame 33
      • 4.2.11 (frame 34)
      • 4.2.12
      • 4.2.13 (frame 36)
      • 4.2.14 (frame 39)
      • 4.2.15 (frame 40
      • 4.2.16 (frame 44
      • 4.2.17 (frame 44 again
      • 4.2.18 (frame 45
      • 4.2.19 (frame 46
      • 4.2.20 (frame 47
      • 4.2.21 (frame 48
      • 4.2.22 (frame 49
      • 4.2.23 (frame 50
      • 4.2.24 (ftrame 51
      • 4.2.25 (frame 52
      • 4.2.26 (frame 53)
      • 4.2.27 (frame 55)
      • 4.2.28 (frame 56)
      • 4.2.29
      • 4.2.30 (frame 57)
      • 4.2.31 (frame 58)
      • 4.2.32 (frame 59)
      • 4.2.33 (frame 60)
      • 4.2.34 (frame 61)
      • 4.2.35 (frame 62)
    • 4.3.0 Biventricular hypertrophy (frame63)
  • 5.0.0 ELECTROLYTE ABNORMALITIES, DRUG EFFECTS AND THE LONG QT SYNDROMES
  • 6.0.0 Ischemia and Infarction - Introduction (frame i and ii)
  • 7.0.0 Tachycardias- Introduction
  • 8.0.0 The Bradycardias frame i-introduction
  • 9.0.0 The ECG of Heart Murmurs-introduction
  • 10.0.0 The Electrocardiogram in the Emergency Department-Introduction
Powered by Drupal