Home
Understanding the Electrocardiogram

Main navigation

  • Home
  • Understanding ECGs
    • Introduction
User account menu
  • Log in

Breadcrumb

  1. Home
  2. Understanding the Electrocardiogram In Health & Disease
  3. 4.0.0 Ventricular Hypertrophy
  4. 4.2.0 Right Ventricular Hypertrophy (frame 21)

4.2.13 (frame 36)

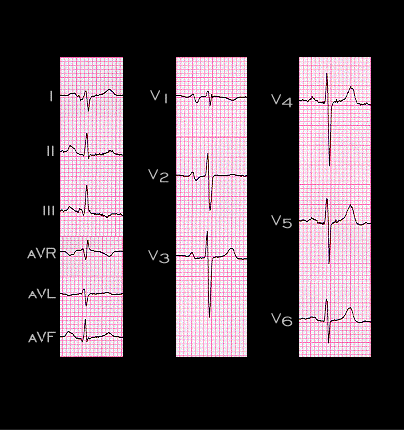
 Now focus your attention on the V leads. Note the small S wave in V1, the somewhat small R wave followed by an S wave in leads V5 and V6, and an R to S ratio of close to 1 in leads V1 and V6. These features reflect the cancellation of the normally unopposed left ventricular forces by the hypertrophied right ventricle, The changes are less pronounced than those seen in the prior two examples in which the right ventricular pressure was elevated to a greater degree, and there was a greater degree of right ventricular hypertrophy. The ECG changes shown here are typical and virtually diagnostic for this group of patients, i.e. those with moderately severe pulmonary hypertension.

Book traversal links for 4.2.13 (frame 36)

  • 4.2.12
  • Up
  • 4.2.14 (frame 39)

Site is under construction

Book navigation

  • Introduction to First Edition
  • 1.0.0 Generation of the ECG
  • 2.0.0 The Normal Electrocardiogram
  • 3.0.0 Inter and intra-ventricular Conduction Disturbances
  • 4.0.0 Ventricular Hypertrophy
    • 4.1.0 Left Ventricular Hypertrophy (frame 1)
    • 4.2.0 Right Ventricular Hypertrophy (frame 21)
      • 4.2.1 (frame 22)
      • 4.2.2 (frame 23)
      • 4.2.3 (frame 24
      • 4.2.4 (frame25)
      • 4.2.5 (frame 27 26 intentionally omitted)
      • 4.2.6(frame 29 frame 28 intentionally omitted)
      • 4.2.8 (frame 31)
      • 4.2.9 (frame 32)
      • 4.2.10(frame 33
      • 4.2.11 (frame 34)
      • 4.2.12
      • 4.2.13 (frame 36)
      • 4.2.14 (frame 39)
      • 4.2.15 (frame 40
      • 4.2.16 (frame 44
      • 4.2.17 (frame 44 again
      • 4.2.18 (frame 45
      • 4.2.19 (frame 46
      • 4.2.20 (frame 47
      • 4.2.21 (frame 48
      • 4.2.22 (frame 49
      • 4.2.23 (frame 50
      • 4.2.24 (ftrame 51
      • 4.2.25 (frame 52
      • 4.2.26 (frame 53)
      • 4.2.27 (frame 55)
      • 4.2.28 (frame 56)
      • 4.2.29
      • 4.2.30 (frame 57)
      • 4.2.31 (frame 58)
      • 4.2.32 (frame 59)
      • 4.2.33 (frame 60)
      • 4.2.34 (frame 61)
      • 4.2.35 (frame 62)
    • 4.3.0 Biventricular hypertrophy (frame63)
  • 5.0.0 ELECTROLYTE ABNORMALITIES, DRUG EFFECTS AND THE LONG QT SYNDROMES
  • 6.0.0 Ischemia and Infarction - Introduction (frame i and ii)
  • 7.0.0 Tachycardias- Introduction
  • 8.0.0 The Bradycardias frame i-introduction
  • 9.0.0 The ECG of Heart Murmurs-introduction
  • 10.0.0 The Electrocardiogram in the Emergency Department-Introduction
Powered by Drupal