
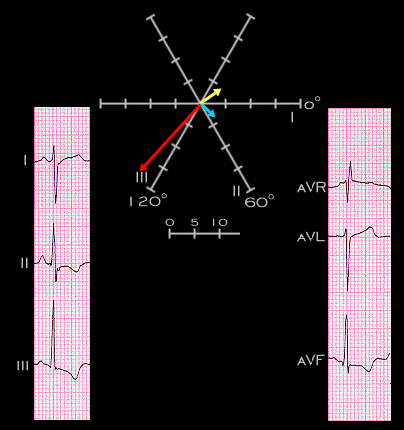
The P wave axis (blue arrow) is + 50 degrees which is normal but the P wave amplitude is increased in lead II. The main QRS axis (red arrow) is +132 degrees. This is abnormal right axis deviation. The T wave axis (yellow arrow) is shifted to the left and is -48 degrees. This is abnormal and the QRS-T angle is abnormally wide.