Home
Understanding the Electrocardiogram

Main navigation

  • Home
  • Understanding ECGs
    • Introduction
User account menu
  • Log in

Breadcrumb

  1. Home
  2. Understanding the Electrocardiogram In Health & Disease
  3. 4.0.0 Ventricular Hypertrophy
  4. 4.2.0 Right Ventricular Hypertrophy (frame 21)

4.2.3 (frame 24

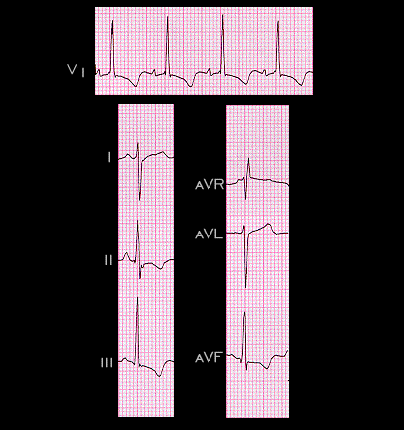
The rate is 100 per minutes. This is obtained by dividing 60 seconds per minute by the R-R interval (0.6 seconds). The rhythm, as determined by the presence and morphology of the P waves, and the relationship of the P waves to the QRS complexes, is sinus. The PR interval is 0.12 second, the QRS duration is 0.08 seconds and the QT interval is 0.34 seconds (360 ms). These values are all normal. Now focus on the frontal plane leads shown here to determine the P, QRS and T wave axes.

Book traversal links for 4.2.3 (frame 24

  • 4.2.2 (frame 23)
  • Up
  • 4.2.4 (frame25)

Site is under construction

Book navigation

  • Introduction to First Edition
  • 1.0.0 Generation of the ECG
  • 2.0.0 The Normal Electrocardiogram
  • 3.0.0 Inter and intra-ventricular Conduction Disturbances
  • 4.0.0 Ventricular Hypertrophy
    • 4.1.0 Left Ventricular Hypertrophy (frame 1)
    • 4.2.0 Right Ventricular Hypertrophy (frame 21)
      • 4.2.1 (frame 22)
      • 4.2.2 (frame 23)
      • 4.2.3 (frame 24
      • 4.2.4 (frame25)
      • 4.2.5 (frame 27 26 intentionally omitted)
      • 4.2.6(frame 29 frame 28 intentionally omitted)
      • 4.2.8 (frame 31)
      • 4.2.9 (frame 32)
      • 4.2.10(frame 33
      • 4.2.11 (frame 34)
      • 4.2.12
      • 4.2.13 (frame 36)
      • 4.2.14 (frame 39)
      • 4.2.15 (frame 40
      • 4.2.16 (frame 44
      • 4.2.17 (frame 44 again
      • 4.2.18 (frame 45
      • 4.2.19 (frame 46
      • 4.2.20 (frame 47
      • 4.2.21 (frame 48
      • 4.2.22 (frame 49
      • 4.2.23 (frame 50
      • 4.2.24 (ftrame 51
      • 4.2.25 (frame 52
      • 4.2.26 (frame 53)
      • 4.2.27 (frame 55)
      • 4.2.28 (frame 56)
      • 4.2.29
      • 4.2.30 (frame 57)
      • 4.2.31 (frame 58)
      • 4.2.32 (frame 59)
      • 4.2.33 (frame 60)
      • 4.2.34 (frame 61)
      • 4.2.35 (frame 62)
    • 4.3.0 Biventricular hypertrophy (frame63)
  • 5.0.0 ELECTROLYTE ABNORMALITIES, DRUG EFFECTS AND THE LONG QT SYNDROMES
  • 6.0.0 Ischemia and Infarction - Introduction (frame i and ii)
  • 7.0.0 Tachycardias- Introduction
  • 8.0.0 The Bradycardias frame i-introduction
  • 9.0.0 The ECG of Heart Murmurs-introduction
  • 10.0.0 The Electrocardiogram in the Emergency Department-Introduction
Powered by Drupal