Home
Understanding the Electrocardiogram

Main navigation

  • Home
  • Understanding ECGs
    • Introduction
User account menu
  • Log in

Breadcrumb

  1. Home
  2. Understanding the Electrocardiogram In Health & Disease
  3. 4.0.0 Ventricular Hypertrophy
  4. 4.2.0 Right Ventricular Hypertrophy (frame 21)

4.2.5 (frame 27 26 intentionally omitted)

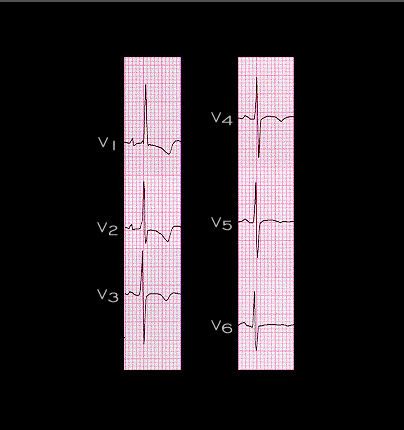
Focus now on the chest leads (V1-6). Notice that there is a tall R wave in V1 with virtually no S wave and that there is a significant S wave in leads V5 and V6. These features indicate that there is a marked increase in the forces directed anteriorly and to the right and that these forces dominate the normal posteriorly directed left ventricular forces. The ST segment in the V leads is normal but the T wave is now inverted in leads V2-5 as well as in V1, indicating a change in the sequence of repolarization. Thus, while the QRS spatial vector has shifted to the right and anteriorly, the T wave spatial vector has shifted to the left and posteriorly. These changes are the opposite of those which occur with left ventricular hypertrophy in which the normal posterior and leftwardly directed QRS forces are exaggerated and the T wave vector is shifted more to the right and more anteriorly.

Book traversal links for 4.2.5 (frame 27 26 intentionally omitted)

  • 4.2.4 (frame25)
  • Up
  • 4.2.6(frame 29 frame 28 intentionally omitted)

Site is under construction

Book navigation

  • Introduction to First Edition
  • 1.0.0 Generation of the ECG
  • 2.0.0 The Normal Electrocardiogram
  • 3.0.0 Inter and intra-ventricular Conduction Disturbances
  • 4.0.0 Ventricular Hypertrophy
    • 4.1.0 Left Ventricular Hypertrophy (frame 1)
    • 4.2.0 Right Ventricular Hypertrophy (frame 21)
      • 4.2.1 (frame 22)
      • 4.2.2 (frame 23)
      • 4.2.3 (frame 24
      • 4.2.4 (frame25)
      • 4.2.5 (frame 27 26 intentionally omitted)
      • 4.2.6(frame 29 frame 28 intentionally omitted)
      • 4.2.8 (frame 31)
      • 4.2.9 (frame 32)
      • 4.2.10(frame 33
      • 4.2.11 (frame 34)
      • 4.2.12
      • 4.2.13 (frame 36)
      • 4.2.14 (frame 39)
      • 4.2.15 (frame 40
      • 4.2.16 (frame 44
      • 4.2.17 (frame 44 again
      • 4.2.18 (frame 45
      • 4.2.19 (frame 46
      • 4.2.20 (frame 47
      • 4.2.21 (frame 48
      • 4.2.22 (frame 49
      • 4.2.23 (frame 50
      • 4.2.24 (ftrame 51
      • 4.2.25 (frame 52
      • 4.2.26 (frame 53)
      • 4.2.27 (frame 55)
      • 4.2.28 (frame 56)
      • 4.2.29
      • 4.2.30 (frame 57)
      • 4.2.31 (frame 58)
      • 4.2.32 (frame 59)
      • 4.2.33 (frame 60)
      • 4.2.34 (frame 61)
      • 4.2.35 (frame 62)
    • 4.3.0 Biventricular hypertrophy (frame63)
  • 5.0.0 ELECTROLYTE ABNORMALITIES, DRUG EFFECTS AND THE LONG QT SYNDROMES
  • 6.0.0 Ischemia and Infarction - Introduction (frame i and ii)
  • 7.0.0 Tachycardias- Introduction
  • 8.0.0 The Bradycardias frame i-introduction
  • 9.0.0 The ECG of Heart Murmurs-introduction
  • 10.0.0 The Electrocardiogram in the Emergency Department-Introduction
Powered by Drupal