
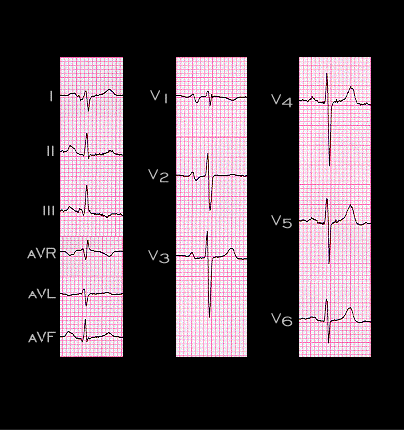
The second category of electrocardiographic changes indicative of right ventricular hypertrophy is that associated with mild to moderate pulmonary hypertension. The ECG shown here and on the following 2 pages is from a 48 year old woman with mitral stenosis. Her pulmonary artery pressure was 45/29 and her right ventricular pressure was 45/7. As you study this tracing, pay particular attention to the P waves, particularly in leads I, II and V1, the P, QRS and T wave axes in the frontal plane, the amplitude of the S wave in leads V1, and the R to S wave ratio in leads V1 and V6.