
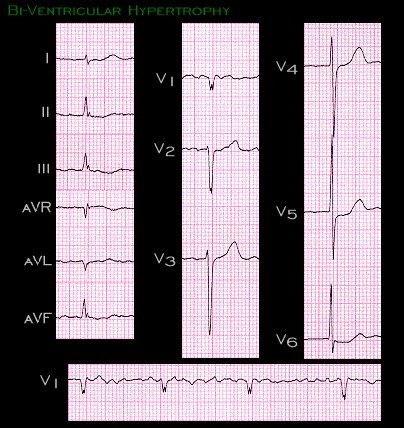
The electrocardiogram in patients with biventricular hypertrophy may show changes that reflect hypertrophy of the individual ventricles. The ECG shown here is from a 72 year old woman with mitral stenosis and aortic insufficiency who was receiving digitalis and whose ECHO showed biventricular hypertrophy. The rhythm is atrial fibrillation. The rightward axis of approximately +100 degrees and the small S wave in lead V1 reflect the right ventricular hypertrophy caused by the mitral stenosis, while the tall R waves in leads V5 and V6 reflect the left ventricular hypertrophy induced by the aortic insufficiency. The ST segment depression, seen best in leads V5 and V6, is probably due to both the left ventricular hypertrophy and to the digitalis therapy.