Home
Understanding the Electrocardiogram

Main navigation

  • Home
  • Understanding ECGs
    • Introduction
User account menu
  • Log in

Breadcrumb

  1. Home
  2. Understanding the Electrocardiogram In Health & Disease
  3. 4.0.0 Ventricular Hypertrophy
  4. 4.1.0 Left Ventricular Hypertrophy (frame 1)

4.1.17 (frame 20)

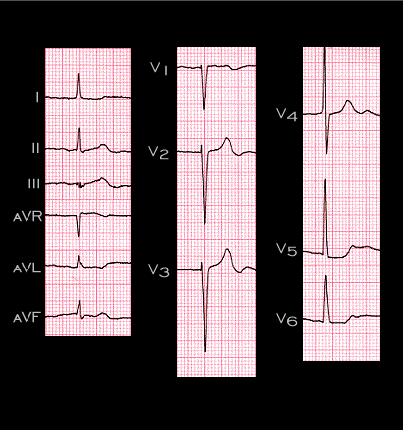
This is the same tracing that was shown on the previous page. It is from an 88 year old female with severe aortic stenosis and atrial fibrillation and demonstrates some features of left ventricular hypertrophy. The S in V1 + the R in V5 = 35mm and the R in aVL + the S in V3 = 28mm. The QRS duration is minimally prolonged (0.10 sec), and there is depression of the ST segment in leads I, V5 and V6. The main QRS axis is normal (+ 30 degrees), the T axis is also within normal limits ( +90 degrees) and the QRS-T angle is at the upper limit of normal (60 degrees). Thus, although the ECG does fulfill several criteria for LVH, the changes are not as dramatic as those seen in the earlier tracings.

Book traversal links for 4.1.17 (frame 20)

  • 4.1.16 (frame 19)
  • Up
  • 4.2.0 Right Ventricular Hypertrophy (frame 21)

Site is under construction

Book navigation

  • Introduction to First Edition
  • 1.0.0 Generation of the ECG
  • 2.0.0 The Normal Electrocardiogram
  • 3.0.0 Inter and intra-ventricular Conduction Disturbances
  • 4.0.0 Ventricular Hypertrophy
    • 4.1.0 Left Ventricular Hypertrophy (frame 1)
      • 4.1.1(OMIT FRAMES 2 AND 3) The image should be from frame 6)
      • 4.1.2 (this is frame 8)
      • 4.1.3 (this is frame 4)
      • 4.1.4 (frame 5)
      • 4.1.5 (this is frame 9)
      • 4.1.6 (fraame 10)
      • 4.1.7(frame 11)
      • 4.1.8 (new Frame)
      • 4.1.9 (frame 12)
      • 4.1.10 (frame 13)
      • 4.1.11 (frame 14)
      • 4.1.12 (frame 15)
      • 4.1.13 (frame 16)
      • 4.1.14 (frame 17)
      • 4.1.15 (frame 18)
      • 4.1.16 (frame 19)
      • 4.1.17 (frame 20)
    • 4.2.0 Right Ventricular Hypertrophy (frame 21)
    • 4.3.0 Biventricular hypertrophy (frame63)
  • 5.0.0 ELECTROLYTE ABNORMALITIES, DRUG EFFECTS AND THE LONG QT SYNDROMES
  • 6.0.0 Ischemia and Infarction - Introduction (frame i and ii)
  • 7.0.0 Tachycardias- Introduction
  • 8.0.0 The Bradycardias frame i-introduction
  • 9.0.0 The ECG of Heart Murmurs-introduction
  • 10.0.0 The Electrocardiogram in the Emergency Department-Introduction
Powered by Drupal