
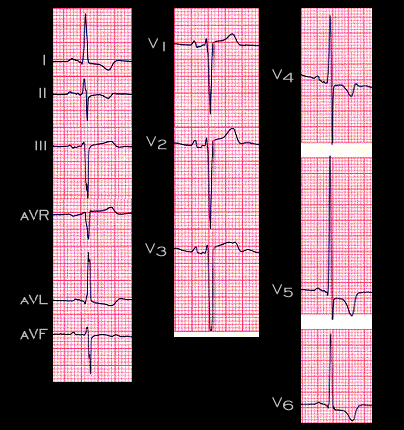
The electrocardiographic changes associated left ventricular hypertrophy are demonstrated in this ECG from a 55 year old male with severe hyperftension (220/129) and an aortic aneurysm. 1.) The P waves are notched in leads I and AVL and the negative component in leads V1 is broadened. These P wave changes are referred to as “P mitrale” and suggest a left atrial abnormality perhaps caused by an increase the left atrial pressure that accompanies an increase in left ventricular diastolic pressure. 2.) The R wave amplitude is increased in leads V5 and V6, the left sided and posterior leads and the amplitude of the S wave is increased in the most right sided and anterior leads, leads V1 and V2. In addition, the QRS duration and the time from the onset of the QRS complex to the peak of the R wave in V5 referred to as the “intrinsicoid deflection” are slightly prolonged. This suggests an increase in the time required for left ventricular depolarization 3.) The ST segment is depressed and the T waves are inverted in leads 1, AVL,V5 and V6. Before going further, take a minute to draw the main QRS and T wave vectors in the frontal plane and to calculate the angle between the QRS complex and the T wave(the QRS- T angle).