Home
Understanding the Electrocardiogram

Main navigation

  • Home
  • Understanding ECGs
    • Introduction
User account menu
  • Log in

Breadcrumb

  1. Home
  2. Understanding the Electrocardiogram In Health & Disease
  3. 4.0.0 Ventricular Hypertrophy
  4. 4.1.0 Left Ventricular Hypertrophy (frame 1)

4.1.10 (frame 13)

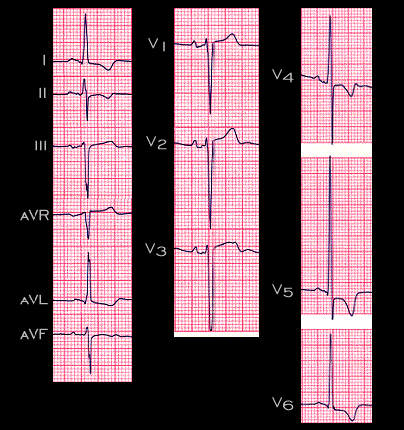
This ECG of the 55 year old hypertensive patient was shown earlier on page 4.1.1. It satisfies virtually all of the various criteria discussed above. Thus, there is a very high likelihood that it does, in fact, indicate left ventricular hypertrophy.

Book traversal links for 4.1.10 (frame 13)

  • 4.1.9 (frame 12)
  • Up
  • 4.1.11 (frame 14)

Site is under construction

Book navigation

  • Introduction to First Edition
  • 1.0.0 Generation of the ECG
  • 2.0.0 The Normal Electrocardiogram
  • 3.0.0 Inter and intra-ventricular Conduction Disturbances
  • 4.0.0 Ventricular Hypertrophy
    • 4.1.0 Left Ventricular Hypertrophy (frame 1)
      • 4.1.1(OMIT FRAMES 2 AND 3) The image should be from frame 6)
      • 4.1.2 (this is frame 8)
      • 4.1.3 (this is frame 4)
      • 4.1.4 (frame 5)
      • 4.1.5 (this is frame 9)
      • 4.1.6 (fraame 10)
      • 4.1.7(frame 11)
      • 4.1.8 (new Frame)
      • 4.1.9 (frame 12)
      • 4.1.10 (frame 13)
      • 4.1.11 (frame 14)
      • 4.1.12 (frame 15)
      • 4.1.13 (frame 16)
      • 4.1.14 (frame 17)
      • 4.1.15 (frame 18)
      • 4.1.16 (frame 19)
      • 4.1.17 (frame 20)
    • 4.2.0 Right Ventricular Hypertrophy (frame 21)
    • 4.3.0 Biventricular hypertrophy (frame63)
  • 5.0.0 ELECTROLYTE ABNORMALITIES, DRUG EFFECTS AND THE LONG QT SYNDROMES
  • 6.0.0 Ischemia and Infarction - Introduction (frame i and ii)
  • 7.0.0 Tachycardias- Introduction
  • 8.0.0 The Bradycardias frame i-introduction
  • 9.0.0 The ECG of Heart Murmurs-introduction
  • 10.0.0 The Electrocardiogram in the Emergency Department-Introduction
Powered by Drupal