
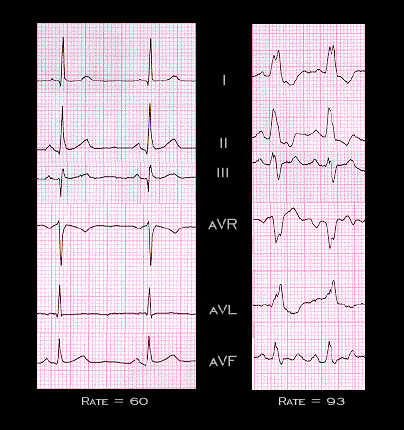
These ECGs demonstrate tachycardia dependent left bundle branch block. The tracing on the left, recorded when the heart rate was 60 (R-R interval: 1.0 sec.), is normal. The tracing on the right, recorded at a heart of 93 (R-R interval: 0.64 sec.), shows left bundle branch block. Note the changes in QRS duration and morphology associated with the development of the left bundle branch block, particularly the loss of the small initial “septal” Q wave in leads I, II and aVL and the appearance of the prominent notch in the QRS complex in leads I and aVL. Also, note once again the secondary T wave changes that occur in association with the development of the left bundle branch block.