Home
Understanding the Electrocardiogram

Main navigation

  • Home
  • Understanding ECGs
    • Introduction
User account menu
  • Log in

Breadcrumb

  1. Home
  2. Understanding the Electrocardiogram In Health & Disease
  3. 3.0.0 Inter and intra-ventricular Conduction Disturbances
  4. 3.3.0 Fascicular blocks (frame 29)

3.3.20(48)

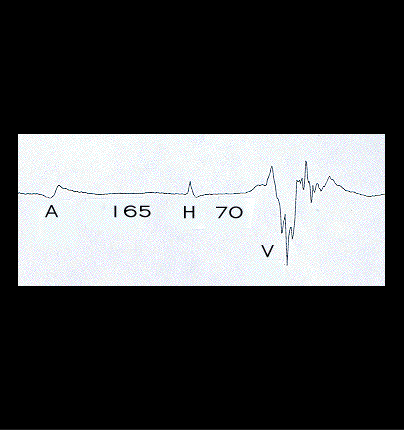
This is the intracardiac His Bundle electrogram from this patient. It is recorded by an electrode catheter placed over the common His bundle just distil to the AV node. The H-V interval, measured from the His bundle spike (H) to the onset of the QRS complex, measures the time for the impulse to travel, after exiting the AV node, through the His-Purkinje system to the onset of ventricular activation (V). It normally measures no longer than 55 ms (0.055 seconds). Here, it is prolonged, measuring 70 ms. This indicates slowing in the left posterior fascicle as well as in the right bundle and left anterior fascicle and confirms the diagnosis of tri-fascicular block. The AH interval, measured from the atrial spike (A) to the His bundle spike (H), measures the time for the impulse to traverse the AV node and should not exceed 120ms. Here it is prolonged, measuring 165 ms. This indicates slowed conduction within the AV node as well.

Book traversal links for 3.3.20(48)

  • 3.3.19 (47)
  • Up
  • 3.3.21 (49)

Site is under construction

Book navigation

  • Introduction to First Edition
  • 1.0.0 Generation of the ECG
  • 2.0.0 The Normal Electrocardiogram
  • 3.0.0 Inter and intra-ventricular Conduction Disturbances
    • 3.0.1 Introduction Continued
    • 3.1.0 Right Bundle Branch Block (RBBB)
    • 3.2.0 Left Bundle Branch Block (LBBB)
    • 3.3.0 Fascicular blocks (frame 29)
      • 3.3.1(30)
      • 3.3.2 (31)
      • 3.3.3 (32)
      • 3.3.4 (33)
      • 3.3.5 (34)
      • 3.3.6
      • 3.3.7 (35)
      • 3.3.8 (36)
      • 3.3.9 (37)
      • 3.3.10 (38)
      • 3.3.11(39)
      • 3.3.12 (40)
      • 3.3.13 (41)
      • 3.3.14 (42)
      • 3.3.15 (new frame)
      • 3.3.16 (43)
      • 3.3.17 (this is now frame 45)
      • 3.3.18 (46)
      • 3.3.19 (47)
      • 3.3.20(48)
      • 3.3.21 (49)
      • 3.3.22(50)
      • 3.3.23 (51)
      • 3.3.24 (frame73)
      • 3.3.25 (frame 74)
    • 3.4.0 Aberrant Ventricular Conduction (52)
    • 3.5.0 Ventricular Pre-excitation (77)
  • 4.0.0 Ventricular Hypertrophy
  • 5.0.0 ELECTROLYTE ABNORMALITIES, DRUG EFFECTS AND THE LONG QT SYNDROMES
  • 6.0.0 Ischemia and Infarction - Introduction (frame i and ii)
  • 7.0.0 Tachycardias- Introduction
  • 8.0.0 The Bradycardias frame i-introduction
  • 9.0.0 The ECG of Heart Murmurs-introduction
  • 10.0.0 The Electrocardiogram in the Emergency Department-Introduction
Powered by Drupal