
{COMBINE THE GRAPHICS WITH THE VECTOR LOOP IN FRAME 44-MAKE INTO A SINGLE FIGURE BY ADDING THE 6 V LEADS}
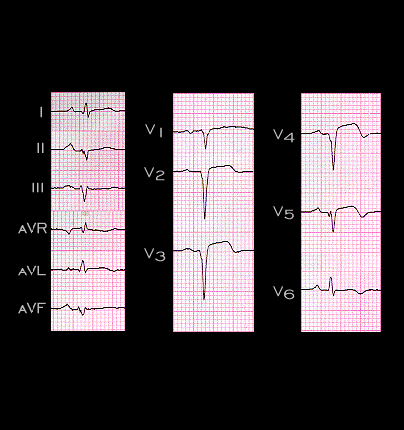
The next several frames illustrate the development of tri-fascicular block, i.e. block in the right bundle and in both the anterior and posterior fascicles of the left bundle. This ECG was recorded from a 45 year old male patient following an anterior wall myocardial infarction. The infarction is responsible or the QS complexes in leads V2-V5 and the inverted T waves in leads V3-V6. The QRS complexes in the limb leads are of low voltage but demonstrate the features of left anterior fascicular block. The initial portion of the QRS complex is directed inferiorly and to the right (axis +150 degrees) with a small Q wave in lead I and aVL, a small initial R wave in leads III and aVF and there is marked left axis deviation (-75 degrees). Note that in this tracing, the PR interval is normal with a duration of 0.17 seconds.