Home
Understanding the Electrocardiogram

Main navigation

  • Home
  • Understanding ECGs
    • Introduction
User account menu
  • Log in

Breadcrumb

  1. Home
  2. Understanding the Electrocardiogram In Health & Disease
  3. 8.0.0 The Bradycardias frame i-introduction
  4. 8.1.0 Sinus Bradycardia and AV block (frame 1)

8.1.20 (frame 21)

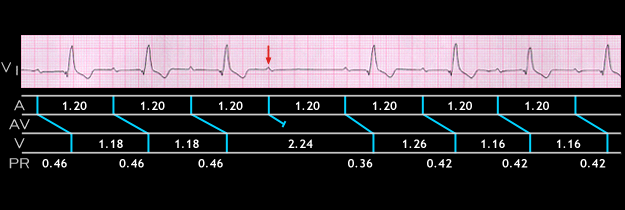
Sometimes, it is difficult to determine whether a non-conducted P wave represents type I or type II AV block, i.e. whether the block is within or distal to the AV node. This ECG is from the patient with diffuse conducting system disease whose ECG demonstrated right bundle branch block, left anterior fascicular block and a prolonged PR interval. It was shown earlier in this chapter (page 8.1.7). The strip of lead V1 shows a single non-conducted P wave (arrow). The PR intervals preceding the blocked P wave are constant (and prolonged), measuring 0.46 seconds. This suggests type II 2nd degree as well as 1st degree AV block. Note however, that the PR interval in the beat following the pause shortens to 0.36 seconds. As a result, the RR interval encompassing the blocked P wave (2.24 seconds) is less than twice the RR interval that preceding it (2 x 1.18 = 2.36 seconds). The PR interval then lengthens to 0.42 seconds.

Slight shortening of the PR interval immediately following a blocked P wave may occur even with type II block and in this patient, type II block is most likely. However, this diagnosis cannot be made with certainty from the body surface ECG.

  • 8.1.21 (22)
  • 8.1.22 (23)
  • 8.1.23 (24)
  • 8.1.24 (25)
  • 8.1.25 (26)
  • 8.1.26 (27)
  • 8.1.27 (28)
  • 8.1.28 (29)
  • 8.1.29 (30)

Book traversal links for 8.1.20 (frame 21)

  • 8.1.19 (frame 20)
  • Up
  • 8.1.21 (22)

Site is under construction

Book navigation

  • Introduction to First Edition
  • 1.0.0 Generation of the ECG
  • 2.0.0 The Normal Electrocardiogram
  • 3.0.0 Inter and intra-ventricular Conduction Disturbances
  • 4.0.0 Ventricular Hypertrophy
  • 5.0.0 ELECTROLYTE ABNORMALITIES, DRUG EFFECTS AND THE LONG QT SYNDROMES
  • 6.0.0 Ischemia and Infarction - Introduction (frame i and ii)
  • 7.0.0 Tachycardias- Introduction
  • 8.0.0 The Bradycardias frame i-introduction
    • 8.1.0 Sinus Bradycardia and AV block (frame 1)
      • 8.1.1 (2)
      • 8.1.2 (3)
      • 8.1.3 (4)
      • 8.1.4 (5)
      • 8.1.5 (6)
      • 8.1.6 (7)
      • 8.1.7 (8)
      • 8.1.8 (9)
      • 8.1.9 (10)
      • 8.1.10 (frame 11)
      • 8.1.20 (frame 21)
        • 8.1.21 (22)
        • 8.1.22 (23)
        • 8.1.23 (24)
        • 8.1.24 (25)
        • 8.1.25 (26)
        • 8.1.26 (27)
        • 8.1.27 (28)
        • 8.1.28 (29)
        • 8.1.29 (30)
      • 8.1.30 (frame 31)
    • 8.2.0 SA Block (frame 41)
    • 8.3.0 Group Beating (frame 57)
  • 9.0.0 The ECG of Heart Murmurs-introduction
  • 10.0.0 The Electrocardiogram in the Emergency Department-Introduction
Powered by Drupal