Home
Understanding the Electrocardiogram

Main navigation

  • Home
  • Understanding ECGs
    • Introduction
User account menu
  • Log in

Breadcrumb

  1. Home
  2. Understanding the Electrocardiogram In Health & Disease
  3. 8.0.0 The Bradycardias frame i-introduction
  4. 8.1.0 Sinus Bradycardia and AV block (frame 1)
  5. 8.1.10 (frame 11)

8.1.14 (15)

[THE DELTA PR UNDER THE LADDER IS INCORRECT. SHOULD BE 0 (NOT 0.02) BETWEEN BEATS 3&4 AS WELL AS BETWEEN BEATS 9 &10 AND 10&11-ALSO. IS IT POSSIBLE TO PUT IN A MAGNIFIER FOR THE ECG STRIP?]

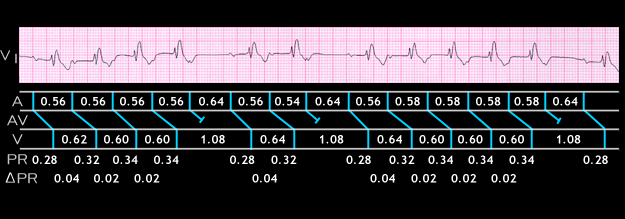
Type 1 2nd degree AV block with Wenckebach periodicity also occurs in patients with underlying diffuse conduction system disease. The ECG shown here is from a 48 year old patient with right bundle branch block and left anterior fascicular block. There is sinus rhythm and type 1 second degree AV block with 5:4, 3:2 and 6:5 AV ratios. The exact location of the P wave after the initial P in each group is often difficult to determine because it is buried in the T wave. Thus, the various PP. PR and delta [USE GREEK LETTER] PR intervals shown may not be precise.

The PP intervals range from 0.54 to 0.64 seconds. The initial PR interval in each group is prolonged (0.28 seconds), This could be due to conduction slowing in the AV node or in the posterior fascicle of the left bundle. In each group, there is an increase of 0.04 seconds in the PR interval of the second P wave so that its PR interval is 0.32 seconds. Thereafter, any further increase in PR interval prior to the blocked P wave is difficult to determine because its location within the T wave affects the accuracy of the measurement. Note that the RR interval between the first two QRS complexes in each group (0.62 seconds) is longer than that of the subsequent complexes. This pattern is typical of the classical Wenckebach structure.

Book traversal links for 8.1.14 (15)

  • 8.1.13 (14)
  • Up
  • 8.1.15 (16)

Site is under construction

Book navigation

  • Introduction to First Edition
  • 1.0.0 Generation of the ECG
  • 2.0.0 The Normal Electrocardiogram
  • 3.0.0 Inter and intra-ventricular Conduction Disturbances
  • 4.0.0 Ventricular Hypertrophy
  • 5.0.0 ELECTROLYTE ABNORMALITIES, DRUG EFFECTS AND THE LONG QT SYNDROMES
  • 6.0.0 Ischemia and Infarction - Introduction (frame i and ii)
  • 7.0.0 Tachycardias- Introduction
  • 8.0.0 The Bradycardias frame i-introduction
    • 8.1.0 Sinus Bradycardia and AV block (frame 1)
      • 8.1.1 (2)
      • 8.1.2 (3)
      • 8.1.3 (4)
      • 8.1.4 (5)
      • 8.1.5 (6)
      • 8.1.6 (7)
      • 8.1.7 (8)
      • 8.1.8 (9)
      • 8.1.9 (10)
      • 8.1.10 (frame 11)
        • 8.1.11 (12)
        • 8.1.12 (13)
        • 8.1.13 (14)
        • 8.1.14 (15)
        • 8.1.15 (16)
        • 8.1.16 (17)
        • 8.1.17 (18)
        • 8.1.18 (19)
        • 8.1.19 (frame 20)
      • 8.1.20 (frame 21)
      • 8.1.30 (frame 31)
    • 8.2.0 SA Block (frame 41)
    • 8.3.0 Group Beating (frame 57)
  • 9.0.0 The ECG of Heart Murmurs-introduction
  • 10.0.0 The Electrocardiogram in the Emergency Department-Introduction
Powered by Drupal