
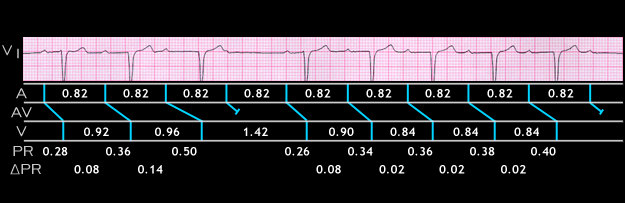
This is another example of Mobitz I block. It is from a 60 year old male with congestive heart failure who was receiving several medications including digitalis. It shows a group with 4:3 AV block followed by a group with 6:5 AV block. Note that there are subtle differences in the progressive increments in the PR interval that precede the blocked P waves. These progressive increments are identified as delta (USE GREEK LETTER) PR and are shown under the ladder diagram. In the first group, the PR increases from 0.26 to 0.36 seconds, an increment (delta PR) of 0.08 seconds. The PR interval then increases to 0.50 seconds, a further increment of 0.14 seconds. The next P wave is blocked. The PR interval in the first beat after the blocked P is prolonged, measuring 0.26 seconds. Again, note that the RR interval encompassing the blocked P wave (1.42 seconds) is less than twice the preceding RR interval (2 x 0.96 = 1.92 seconds).
In the second group, the PR interval increases from 0.26 to 0.34 and then to 0.36, 0.38 and 0.40 seconds before the blocked P wave. The increment of the PR interval is greatest after the second P wave (0.08 seconds). After that, the PR interval continues to increase but with a lesser increment (0.02 seconds). This is the more classical Wenckebach structure and results in the RR interval between the first two QRS complexes of the group (in this case 0.90 seconds) being longer than the RR intervals between the subsequent QRS complexes (in this case, 0.84 seconds). In this patient, both the prolongation of the PR interval of the first beat following each of the two pauses (1st degree AV block) and the type 1 2nd degree AV block were caused by digitalis and are manifestations of “digitalis toxicity”.