Home
Understanding the Electrocardiogram

Main navigation

  • Home
  • Understanding ECGs
    • Introduction
User account menu
  • Log in

Breadcrumb

  1. Home
  2. Understanding the Electrocardiogram In Health & Disease
  3. 8.0.0 The Bradycardias frame i-introduction
  4. 8.1.0 Sinus Bradycardia and AV block (frame 1)
  5. 8.1.10 (frame 11)

8.1.12 (13)

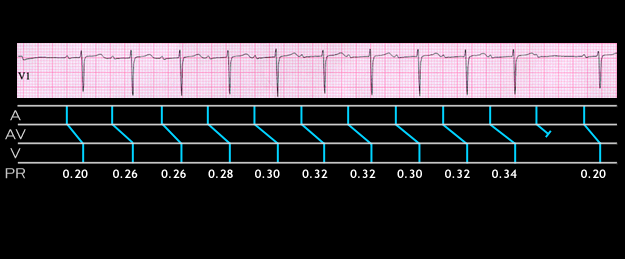
This ECG is another example of type 1 2nd degree AV block, but here, the P:QRS ratio is 11:10. Note that the PR interval,shown below the ladder diagram, initially increases from 0.20 to 0.26 seconds, an increment of 0.06 seconds. Thereafter, it increments by no more than 0.02 seconds. This is the typical Wenckebach structure.

Book traversal links for 8.1.12 (13)

  • 8.1.11 (12)
  • Up
  • 8.1.13 (14)

Site is under construction

Book navigation

  • Introduction to First Edition
  • 1.0.0 Generation of the ECG
  • 2.0.0 The Normal Electrocardiogram
  • 3.0.0 Inter and intra-ventricular Conduction Disturbances
  • 4.0.0 Ventricular Hypertrophy
  • 5.0.0 ELECTROLYTE ABNORMALITIES, DRUG EFFECTS AND THE LONG QT SYNDROMES
  • 6.0.0 Ischemia and Infarction - Introduction (frame i and ii)
  • 7.0.0 Tachycardias- Introduction
  • 8.0.0 The Bradycardias frame i-introduction
    • 8.1.0 Sinus Bradycardia and AV block (frame 1)
      • 8.1.1 (2)
      • 8.1.2 (3)
      • 8.1.3 (4)
      • 8.1.4 (5)
      • 8.1.5 (6)
      • 8.1.6 (7)
      • 8.1.7 (8)
      • 8.1.8 (9)
      • 8.1.9 (10)
      • 8.1.10 (frame 11)
        • 8.1.11 (12)
        • 8.1.12 (13)
        • 8.1.13 (14)
        • 8.1.14 (15)
        • 8.1.15 (16)
        • 8.1.16 (17)
        • 8.1.17 (18)
        • 8.1.18 (19)
        • 8.1.19 (frame 20)
      • 8.1.20 (frame 21)
      • 8.1.30 (frame 31)
    • 8.2.0 SA Block (frame 41)
    • 8.3.0 Group Beating (frame 57)
  • 9.0.0 The ECG of Heart Murmurs-introduction
  • 10.0.0 The Electrocardiogram in the Emergency Department-Introduction
Powered by Drupal