
[I WANT TO MODIFY THE FIGURE SLIGHTLY BY PUTTING NUMBERS (1,2,3) ABOVE THE P WAVES AND SHOWING THE STp and Tp IN DASHED LINES FOR P#1. ALSO PLACE AN ARROW POINTED AT THE NEGATIVE COMPONENT AT THE END OF THE 2ND T WAVE]
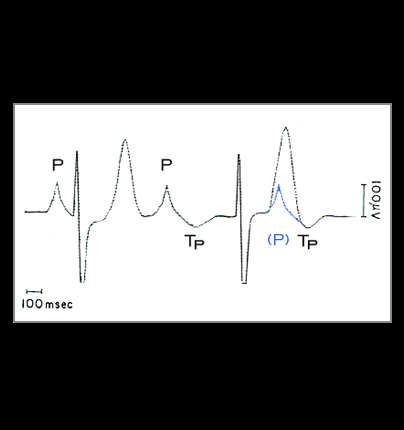
This figure is adapted from the work of Hayashi et al (Am Heart J. 91: 689, 1976) and illustrates the impact of atrial repolarization on the ST segment. Note that in this example, there is complete AV block and that the P-P interval is shorter than the R-R interval, i,e, the atrial rate is faster than the ventricular rate. The second P wave occurs well before the second QRS complex. As a result, the ST segment and T wave of this P wave (Tp) are well seen and the ST segment following the second QRS complex is not depressed. Now focus on the first P wave. It occurs in close proximity to QRS complex that follows it. As a result, the ST segment following this QRS complex is influenced by the first Tp and is depressed. Note also, that the T wave following the second QRS complex is taller than the T wave that follows the first QRS complex because of superimposition of the third P wave, (P), which is hidden in the T wave, but is shown in blue. The Tp wave of this P wave is responsible for the terminal negative component of the T wave which follows the second QRS complex.