Home
Understanding the Electrocardiogram

Main navigation

  • Home
  • Understanding ECGs
    • Introduction
User account menu
  • Log in

Breadcrumb

  1. Home
  2. Understanding the Electrocardiogram In Health & Disease
  3. 6.0.0 Ischemia and Infarction - Introduction (frame i and ii)
  4. 6.5.0 (frame 106) FALSE POSITIVES
  5. 6.5.30 (frame 136)

6.5.32 (138)

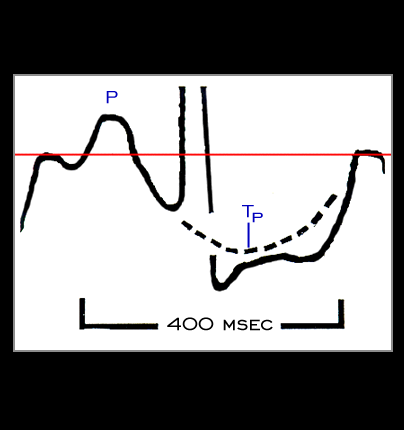
Atrial repolarization is an under-appreciated cause of ST segment depression capable of simulating myocardial ischemia. As discussed earlier, the P waves on the body surface electrocardiogram reflect atrial depolarization, but the ECG manifestations of atrial repolarization, i.e. the atrial ST segment and the atrial T wave, (Tp), are not seen because they are contained within the ventricular ST segment and T wave. The broken lines shown in this figure represent the atrial ST segment and T wave as they would appear if there were no QRS complex, ST segment or T wave. Note that the atrial ST segment and atrial T wave are opposite in direction to the P wave and that the interval from the onset of the P wave to the end of the Tp wave measures 400ms when the rate, although not obvious in the figure, is 80 beats per minute.

It is important to point out again that the atrial ST segment and atrial T wave are opposite in direction to the P wave. Thus, the ability of atrial repolarization to cause ST depression will be seen best in leads in which the P wave is most positive. Conversely, in leads in which the P wave is inverted, the atrial repolarization waves will be upright and capable of causing ST segment elevation.

Book traversal links for 6.5.32 (138)

  • 6.5.31 (137)
  • Up
  • 6.5.33 (139)

Site is under construction

Book navigation

  • Introduction to First Edition
  • 1.0.0 Generation of the ECG
  • 2.0.0 The Normal Electrocardiogram
  • 3.0.0 Inter and intra-ventricular Conduction Disturbances
  • 4.0.0 Ventricular Hypertrophy
  • 5.0.0 ELECTROLYTE ABNORMALITIES, DRUG EFFECTS AND THE LONG QT SYNDROMES
  • 6.0.0 Ischemia and Infarction - Introduction (frame i and ii)
    • 6.1.0 ST Segment (frame1)
    • 6.2.0 Q WAVES (frame 53)
    • 6.3.0 T WAVES (frame 75)
    • 6.4.0 (Bundle Branch Blocks and othe IVCDs--frame 87)
    • 6.5.0 (frame 106) FALSE POSITIVES
      • 6.5.1 (107)
      • 6.5.2 (108)
      • 6.5.3 (109)
      • 6.5.4(frame 110)
      • 6.5.5 (111)
      • 6.5.6 (112)
      • 6.5.7 (113)
      • 6.5.8 (114)
      • 6.5.9 (115)
      • 6.5.10 (116)
      • 6.5.20
      • 6.5.30 (frame 136)
        • 6.5.31 (137)
        • 6.5.32 (138)
        • 6.5.33 (139)
        • 6.5.34 (no image)
  • 7.0.0 Tachycardias- Introduction
  • 8.0.0 The Bradycardias frame i-introduction
  • 9.0.0 The ECG of Heart Murmurs-introduction
  • 10.0.0 The Electrocardiogram in the Emergency Department-Introduction
Powered by Drupal