Home
Understanding the Electrocardiogram

Main navigation

  • Home
  • Understanding ECGs
    • Introduction
User account menu
  • Log in

Breadcrumb

  1. Home
  2. Understanding the Electrocardiogram In Health & Disease
  3. 6.0.0 Ischemia and Infarction - Introduction (frame i and ii)
  4. 6.5.0 (frame 106) FALSE POSITIVES

6.5.3 (109)

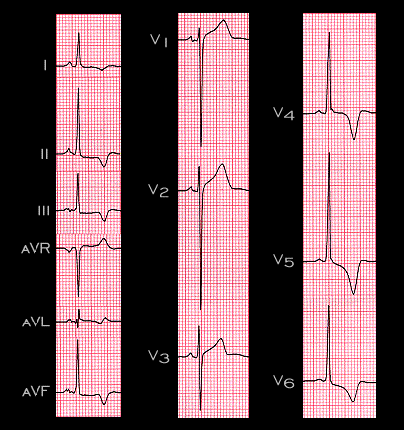
An even more dramatic example of giant T wave inversion may occur in patients with the hypertrophic cardiomyopathies. This ECG is from a 22 year old male with asymmetric hypertrophy of the interventricular septum and apex. The marked increase in QRS voltage in the chest leads, although at the very upper limits of normal for a male of this age, probably reflects the ventricular hypertrophy.

Book traversal links for 6.5.3 (109)

  • 6.5.2 (108)
  • Up
  • 6.5.4(frame 110)

Site is under construction

Book navigation

  • Introduction to First Edition
  • 1.0.0 Generation of the ECG
  • 2.0.0 The Normal Electrocardiogram
  • 3.0.0 Inter and intra-ventricular Conduction Disturbances
  • 4.0.0 Ventricular Hypertrophy
  • 5.0.0 ELECTROLYTE ABNORMALITIES, DRUG EFFECTS AND THE LONG QT SYNDROMES
  • 6.0.0 Ischemia and Infarction - Introduction (frame i and ii)
    • 6.1.0 ST Segment (frame1)
    • 6.2.0 Q WAVES (frame 53)
    • 6.3.0 T WAVES (frame 75)
    • 6.4.0 (Bundle Branch Blocks and othe IVCDs--frame 87)
    • 6.5.0 (frame 106) FALSE POSITIVES
      • 6.5.1 (107)
      • 6.5.2 (108)
      • 6.5.3 (109)
      • 6.5.4(frame 110)
      • 6.5.5 (111)
      • 6.5.6 (112)
      • 6.5.7 (113)
      • 6.5.8 (114)
      • 6.5.9 (115)
      • 6.5.10 (116)
      • 6.5.20
      • 6.5.30 (frame 136)
  • 7.0.0 Tachycardias- Introduction
  • 8.0.0 The Bradycardias frame i-introduction
  • 9.0.0 The ECG of Heart Murmurs-introduction
  • 10.0.0 The Electrocardiogram in the Emergency Department-Introduction
Powered by Drupal