Home
Understanding the Electrocardiogram

Main navigation

  • Home
  • Understanding ECGs
    • Introduction
User account menu
  • Log in

Breadcrumb

  1. Home
  2. Understanding the Electrocardiogram In Health & Disease
  3. 6.0.0 Ischemia and Infarction - Introduction (frame i and ii)
  4. 6.5.0 (frame 106) FALSE POSITIVES

6.5.2 (108)

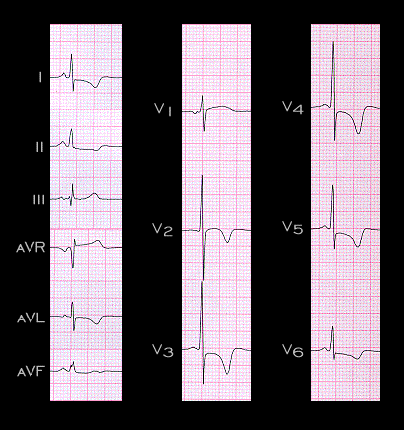
The giant inverted T waves that were shown in association with both the CVA pattern and with a prior ischemic event (see pages 6.3.7 and 6.3.5) may also occur in other situations. The ECG shown here is from a 54 year old male with long-standing hypertension but no evidence of ischemic heart disease. His coronary angiogram was normal. These T wave changes are due to left ventricular hypertrophy resulting from the hypertension.

Book traversal links for 6.5.2 (108)

  • 6.5.1 (107)
  • Up
  • 6.5.3 (109)

Site is under construction

Book navigation

  • Introduction to First Edition
  • 1.0.0 Generation of the ECG
  • 2.0.0 The Normal Electrocardiogram
  • 3.0.0 Inter and intra-ventricular Conduction Disturbances
  • 4.0.0 Ventricular Hypertrophy
  • 5.0.0 ELECTROLYTE ABNORMALITIES, DRUG EFFECTS AND THE LONG QT SYNDROMES
  • 6.0.0 Ischemia and Infarction - Introduction (frame i and ii)
    • 6.1.0 ST Segment (frame1)
    • 6.2.0 Q WAVES (frame 53)
    • 6.3.0 T WAVES (frame 75)
    • 6.4.0 (Bundle Branch Blocks and othe IVCDs--frame 87)
    • 6.5.0 (frame 106) FALSE POSITIVES
      • 6.5.1 (107)
      • 6.5.2 (108)
      • 6.5.3 (109)
      • 6.5.4(frame 110)
      • 6.5.5 (111)
      • 6.5.6 (112)
      • 6.5.7 (113)
      • 6.5.8 (114)
      • 6.5.9 (115)
      • 6.5.10 (116)
      • 6.5.20
      • 6.5.30 (frame 136)
  • 7.0.0 Tachycardias- Introduction
  • 8.0.0 The Bradycardias frame i-introduction
  • 9.0.0 The ECG of Heart Murmurs-introduction
  • 10.0.0 The Electrocardiogram in the Emergency Department-Introduction
Powered by Drupal