Home
Understanding the Electrocardiogram

Main navigation

  • Home
  • Understanding ECGs
    • Introduction
User account menu
  • Log in

Breadcrumb

  1. Home
  2. Understanding the Electrocardiogram In Health & Disease
  3. 6.0.0 Ischemia and Infarction - Introduction (frame i and ii)
  4. 6.1.0 ST Segment (frame1)
  5. 6.1.40 (frame 39)

6.1.48 (47)

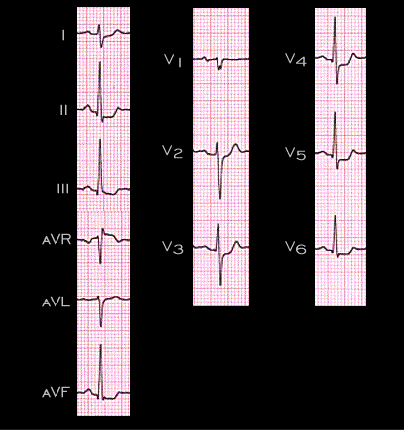
Another example of the inability of ST depression to localize the ischemic zone or the location of the culprit lesion is illustrated in this ECG. It is from from a 72 year old male and was recorded during a treadmill exercise test performed to evaluate the symptoms of chest pain and shortness of breath brought on by exercise and relieved by rest. The resting tracing (not shown) was normal. The ECG performed during exercise (shown here) reveals horizontal depression of the ST segment in leads V3-V5 and in leads II, III and aVF. There is also ST segment elevation in lead aVR. The coronary angiogram from this patient, depicted on the next page, revealed a high grade lesion in the right coronary artery, but only moderate disease in the other coronary arteries.

Book traversal links for 6.1.48 (47)

  • 6.1.47 (46)
  • Up
  • 6.1.49 (48)

Site is under construction

Book navigation

  • Introduction to First Edition
  • 1.0.0 Generation of the ECG
  • 2.0.0 The Normal Electrocardiogram
  • 3.0.0 Inter and intra-ventricular Conduction Disturbances
  • 4.0.0 Ventricular Hypertrophy
  • 5.0.0 ELECTROLYTE ABNORMALITIES, DRUG EFFECTS AND THE LONG QT SYNDROMES
  • 6.0.0 Ischemia and Infarction - Introduction (frame i and ii)
    • 6.1.0 ST Segment (frame1)
      • 6.1.1 (2)
      • 6.1.2(3)
      • 6.1.3(4)
      • 6.1.4(5)
      • 6.1.5(6)
      • 6.1.6 (7)
      • 6.1.7 (8)
      • 6.1.8 (new frame)
      • 6.1.9 (9)
      • 6.1.10 (frame 10)
      • 6.1.20 (frame 20)
      • 6.1.30 (frame 30)
      • 6.1.40 (frame 39)
        • 6.1.41(frame 40)
        • 6.1.42 (41)
        • 6.1.43 (42)
        • 6.1.44 (43)
        • 6.1.45 (44)
        • 6.1.46 (45)
        • 6.1.47 (46)
        • 6.1.48 (47)
        • 6.1.49 (48)
      • 6.1.50 (49)
    • 6.2.0 Q WAVES (frame 53)
    • 6.3.0 T WAVES (frame 75)
    • 6.4.0 (Bundle Branch Blocks and othe IVCDs--frame 87)
    • 6.5.0 (frame 106) FALSE POSITIVES
  • 7.0.0 Tachycardias- Introduction
  • 8.0.0 The Bradycardias frame i-introduction
  • 9.0.0 The ECG of Heart Murmurs-introduction
  • 10.0.0 The Electrocardiogram in the Emergency Department-Introduction
Powered by Drupal