Home
Understanding the Electrocardiogram

Main navigation

  • Home
  • Understanding ECGs
    • Introduction
User account menu
  • Log in

Breadcrumb

  1. Home
  2. Understanding the Electrocardiogram In Health & Disease
  3. 6.0.0 Ischemia and Infarction - Introduction (frame i and ii)
  4. 6.1.0 ST Segment (frame1)

6.1.4(5)

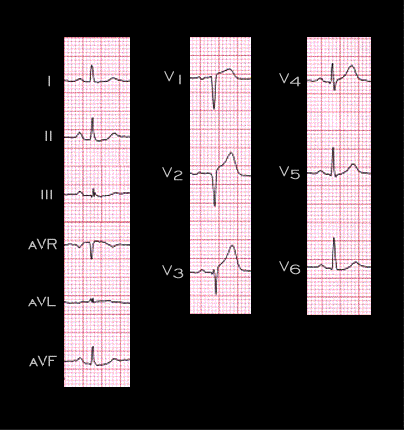
This ECG was recorded one hour after the onset of severe, crushing left anterior chest pain in a 74 year old woman. Note the elevation of the ST segment in leads V1-V3. It measures 1 mm in V1 and 2 mm in leads V2 and V3. The T wave in these leads is quite tall. These changes suggest acute transmural ischemia of the left ventricular anterior wall and are consistent with an acute coronary event caused by an occlusion of the left anterior descending coronary artery.

Book traversal links for 6.1.4(5)

  • 6.1.3(4)
  • Up
  • 6.1.5(6)

Site is under construction

Book navigation

  • Introduction to First Edition
  • 1.0.0 Generation of the ECG
  • 2.0.0 The Normal Electrocardiogram
  • 3.0.0 Inter and intra-ventricular Conduction Disturbances
  • 4.0.0 Ventricular Hypertrophy
  • 5.0.0 ELECTROLYTE ABNORMALITIES, DRUG EFFECTS AND THE LONG QT SYNDROMES
  • 6.0.0 Ischemia and Infarction - Introduction (frame i and ii)
    • 6.1.0 ST Segment (frame1)
      • 6.1.1 (2)
      • 6.1.2(3)
      • 6.1.3(4)
      • 6.1.4(5)
      • 6.1.5(6)
      • 6.1.6 (7)
      • 6.1.7 (8)
      • 6.1.8 (new frame)
      • 6.1.9 (9)
      • 6.1.10 (frame 10)
      • 6.1.20 (frame 20)
      • 6.1.30 (frame 30)
      • 6.1.40 (frame 39)
      • 6.1.50 (49)
    • 6.2.0 Q WAVES (frame 53)
    • 6.3.0 T WAVES (frame 75)
    • 6.4.0 (Bundle Branch Blocks and othe IVCDs--frame 87)
    • 6.5.0 (frame 106) FALSE POSITIVES
  • 7.0.0 Tachycardias- Introduction
  • 8.0.0 The Bradycardias frame i-introduction
  • 9.0.0 The ECG of Heart Murmurs-introduction
  • 10.0.0 The Electrocardiogram in the Emergency Department-Introduction
Powered by Drupal