Home
Understanding the Electrocardiogram

Main navigation

  • Home
  • Understanding ECGs
    • Introduction
User account menu
  • Log in

Breadcrumb

  1. Home
  2. Understanding the Electrocardiogram In Health & Disease
  3. 6.0.0 Ischemia and Infarction - Introduction (frame i and ii)
  4. 6.1.0 ST Segment (frame1)

6.1.5(6)

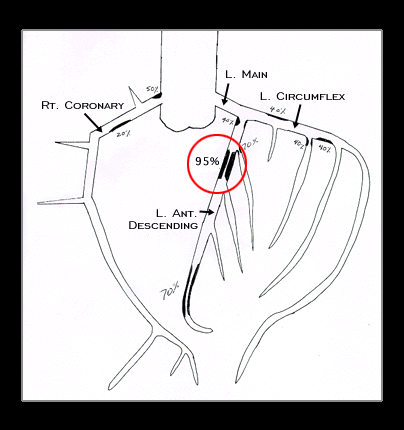
Her coronary angiogram, depicted here, demonstrated a 95% stenosis of the proximal left anterior descending coronary artery and a 70% stenosis in its distal portion. There were also lesser degrees of stenosis scattered throughout the right and circumflex coronary arteries.

Book traversal links for 6.1.5(6)

  • 6.1.4(5)
  • Up
  • 6.1.6 (7)

Site is under construction

Book navigation

  • Introduction to First Edition
  • 1.0.0 Generation of the ECG
  • 2.0.0 The Normal Electrocardiogram
  • 3.0.0 Inter and intra-ventricular Conduction Disturbances
  • 4.0.0 Ventricular Hypertrophy
  • 5.0.0 ELECTROLYTE ABNORMALITIES, DRUG EFFECTS AND THE LONG QT SYNDROMES
  • 6.0.0 Ischemia and Infarction - Introduction (frame i and ii)
    • 6.1.0 ST Segment (frame1)
      • 6.1.1 (2)
      • 6.1.2(3)
      • 6.1.3(4)
      • 6.1.4(5)
      • 6.1.5(6)
      • 6.1.6 (7)
      • 6.1.7 (8)
      • 6.1.8 (new frame)
      • 6.1.9 (9)
      • 6.1.10 (frame 10)
      • 6.1.20 (frame 20)
      • 6.1.30 (frame 30)
      • 6.1.40 (frame 39)
      • 6.1.50 (49)
    • 6.2.0 Q WAVES (frame 53)
    • 6.3.0 T WAVES (frame 75)
    • 6.4.0 (Bundle Branch Blocks and othe IVCDs--frame 87)
    • 6.5.0 (frame 106) FALSE POSITIVES
  • 7.0.0 Tachycardias- Introduction
  • 8.0.0 The Bradycardias frame i-introduction
  • 9.0.0 The ECG of Heart Murmurs-introduction
  • 10.0.0 The Electrocardiogram in the Emergency Department-Introduction
Powered by Drupal