Home
Understanding the Electrocardiogram

Main navigation

  • Home
  • Understanding ECGs
    • Introduction
User account menu
  • Log in

Breadcrumb

  1. Home
  2. Understanding the Electrocardiogram In Health & Disease
  3. 6.0.0 Ischemia and Infarction - Introduction (frame i and ii)
  4. 6.1.0 ST Segment (frame1)

6.1.10 (frame 10)

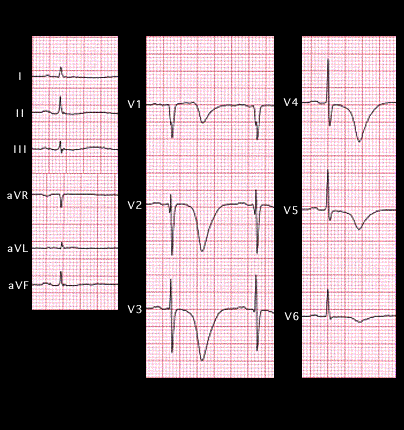
The ECG shown here is from a 70 year old male recorded 24 hours after an episode of severe retrosternal chest pain that was associated with shortness of breath. The deeply inverted T waves in the chest leads and the marked prolongation of the QT interval (580ms) are referred to as “giant T wave inversion.” These changes are consistent with, but not specific for, a non-transmural ischemic event resulting from sub-total occlusion of the left anterior descending coronary artery. When caused by an ischemic event, the T wave changes occur after the ST segment changes of acute ischemia have resolved, i.e., they are post-ischemic. The marked QT prolongation is usually short lived, lasting no more than a few days. Its mechanism is thought due to sympathetically mediated events which influence the repolarization phases of the action potential.

Giant T wave inversion may also be seen with a variety of non-ischemic events. The most common non cardiac cause is an intracranial hemorrhage or other central nervous system abnormalities. In this situation, the ECG changes are referred to as the “CVA pattern.”

  • 6.1.11 (11)
  • 6.1.12 (12)
  • 6.1.13 (13)
  • 6.1.14 (14)
  • 6.1.15 (15)
  • 6.1.16 (16)
  • 6.1.17 (17)
  • 6.1.18 (18)
  • 6.1.19 (19)

Book traversal links for 6.1.10 (frame 10)

  • 6.1.9 (9)
  • Up
  • 6.1.11 (11)

Site is under construction

Book navigation

  • Introduction to First Edition
  • 1.0.0 Generation of the ECG
  • 2.0.0 The Normal Electrocardiogram
  • 3.0.0 Inter and intra-ventricular Conduction Disturbances
  • 4.0.0 Ventricular Hypertrophy
  • 5.0.0 ELECTROLYTE ABNORMALITIES, DRUG EFFECTS AND THE LONG QT SYNDROMES
  • 6.0.0 Ischemia and Infarction - Introduction (frame i and ii)
    • 6.1.0 ST Segment (frame1)
      • 6.1.1 (2)
      • 6.1.2(3)
      • 6.1.3(4)
      • 6.1.4(5)
      • 6.1.5(6)
      • 6.1.6 (7)
      • 6.1.7 (8)
      • 6.1.8 (new frame)
      • 6.1.9 (9)
      • 6.1.10 (frame 10)
        • 6.1.11 (11)
        • 6.1.12 (12)
        • 6.1.13 (13)
        • 6.1.14 (14)
        • 6.1.15 (15)
        • 6.1.16 (16)
        • 6.1.17 (17)
        • 6.1.18 (18)
        • 6.1.19 (19)
      • 6.1.20 (frame 20)
      • 6.1.30 (frame 30)
      • 6.1.40 (frame 39)
      • 6.1.50 (49)
    • 6.2.0 Q WAVES (frame 53)
    • 6.3.0 T WAVES (frame 75)
    • 6.4.0 (Bundle Branch Blocks and othe IVCDs--frame 87)
    • 6.5.0 (frame 106) FALSE POSITIVES
  • 7.0.0 Tachycardias- Introduction
  • 8.0.0 The Bradycardias frame i-introduction
  • 9.0.0 The ECG of Heart Murmurs-introduction
  • 10.0.0 The Electrocardiogram in the Emergency Department-Introduction
Powered by Drupal