Home
Understanding the Electrocardiogram

Main navigation

  • Home
  • Understanding ECGs
    • Introduction
User account menu
  • Log in

Breadcrumb

  1. Home
  2. Understanding the Electrocardiogram In Health & Disease
  3. 2.0.0 The Normal Electrocardiogram
  4. 2.5.0 T wave

2.5.9

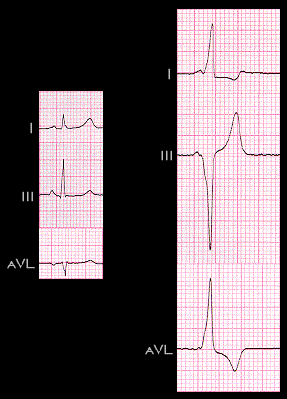
This is another example of a secondary T wave abnormality. In the tracing on the left, the PR interval, QRS complex and T wave are each normal. The tracing on the right, recorded from the same patient, shows ventricular pre-excitation, with a short PR interval and the changes in the shape and duration of the QRS complex that reflect the changes in the sequence of depolarization and changes in the shape ot the T wave. As in the patient with left bundle branch block shown on the preceding page, these T wave changes reflect the changes in the sequence of repolarization that are the necessary result of the changes in the sequence of depolarization

Book traversal links for 2.5.9

  • 2.5.8
  • Up
  • 2.5.10

Site is under construction

Book navigation

  • Introduction to First Edition
  • 1.0.0 Generation of the ECG
  • 2.0.0 The Normal Electrocardiogram
    • 2.1.0 P Wave
    • 2.2.0 PR Interval
    • 2.3.0 QRS Complex
    • 2.4.0 ST segment
    • 2.5.0 T wave
      • 2.5.1
      • 2.5.2
      • 2.5.3
      • 2.5.4
      • 2.5.5
      • 2.5.6
      • 2.5.7
      • 2.5.8
      • 2.5.9
      • 2.5.10
      • 2.5.11
      • 2.5.12
      • 2.5.13
    • 2.6.0 QT Interval
    • 2.7.0 U Wave
  • 3.0.0 Inter and intra-ventricular Conduction Disturbances
  • 4.0.0 Ventricular Hypertrophy
  • 5.0.0 ELECTROLYTE ABNORMALITIES, DRUG EFFECTS AND THE LONG QT SYNDROMES
  • 6.0.0 Ischemia and Infarction - Introduction (frame i and ii)
  • 7.0.0 Tachycardias- Introduction
  • 8.0.0 The Bradycardias frame i-introduction
  • 9.0.0 The ECG of Heart Murmurs-introduction
  • 10.0.0 The Electrocardiogram in the Emergency Department-Introduction
Powered by Drupal