Home
Understanding the Electrocardiogram

Main navigation

  • Home
  • Understanding ECGs
    • Introduction
User account menu
  • Log in

Breadcrumb

  1. Home
  2. Understanding the Electrocardiogram In Health & Disease
  3. 2.0.0 The Normal Electrocardiogram
  4. 2.4.0 ST segment

2.4.3

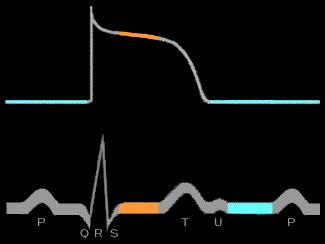
As mentioned earlier, there are normally no voltage gradients in the ventricular myocardial cells when they are at their resting levels (phase 4), the phase represented on the electrocardiogram by the TP segment, or at the plateau level (phase 2), the phase represented by the ST segment. Because of this absence of voltage gradients, the TP and ST segments do not deviate from baseline and are isoelectric with one another. To repeat: IF THERE ARE NO VOLTAGE GRADIENTS, THE ECG WAVEFORM WILL NOT DEVIATE FROM ITS RESTING LEVEL.

Book traversal links for 2.4.3

  • 2.4.2
  • Up
  • 2.5.0 T wave

Site is under construction

Book navigation

  • Introduction to First Edition
  • 1.0.0 Generation of the ECG
  • 2.0.0 The Normal Electrocardiogram
    • 2.1.0 P Wave
    • 2.2.0 PR Interval
    • 2.3.0 QRS Complex
    • 2.4.0 ST segment
      • 2.4.1
      • 2.4.2
      • 2.4.3
    • 2.5.0 T wave
    • 2.6.0 QT Interval
    • 2.7.0 U Wave
  • 3.0.0 Inter and intra-ventricular Conduction Disturbances
  • 4.0.0 Ventricular Hypertrophy
  • 5.0.0 ELECTROLYTE ABNORMALITIES, DRUG EFFECTS AND THE LONG QT SYNDROMES
  • 6.0.0 Ischemia and Infarction - Introduction (frame i and ii)
  • 7.0.0 Tachycardias- Introduction
  • 8.0.0 The Bradycardias frame i-introduction
  • 9.0.0 The ECG of Heart Murmurs-introduction
  • 10.0.0 The Electrocardiogram in the Emergency Department-Introduction
Powered by Drupal