Home
Understanding the Electrocardiogram

Main navigation

  • Home
  • Understanding ECGs
    • Introduction
User account menu
  • Log in

Breadcrumb

  1. Home
  2. Understanding the Electrocardiogram In Health & Disease
  3. 2.0.0 The Normal Electrocardiogram
  4. 2.5.0 T wave

2.5.13

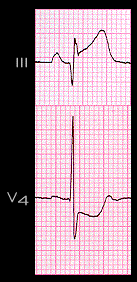
In contrast, deviation of the ST segment from baseline, either with or without associated T wave changes, indicates the development of abnormal voltage gradients during the plateau phase of the ventricular action potential and is almost always a manifestation of cardiac disease, the result of electrolyte abnormalities, or the effects of cardioactive drugs. In the example shown here, the ST segment changes are the result of an acute myocardial infarction.

Book traversal links for 2.5.13

  • 2.5.12
  • Up
  • 2.6.0 QT Interval

Site is under construction

Book navigation

  • Introduction to First Edition
  • 1.0.0 Generation of the ECG
  • 2.0.0 The Normal Electrocardiogram
    • 2.1.0 P Wave
    • 2.2.0 PR Interval
    • 2.3.0 QRS Complex
    • 2.4.0 ST segment
    • 2.5.0 T wave
      • 2.5.1
      • 2.5.2
      • 2.5.3
      • 2.5.4
      • 2.5.5
      • 2.5.6
      • 2.5.7
      • 2.5.8
      • 2.5.9
      • 2.5.10
      • 2.5.11
      • 2.5.12
      • 2.5.13
    • 2.6.0 QT Interval
    • 2.7.0 U Wave
  • 3.0.0 Inter and intra-ventricular Conduction Disturbances
  • 4.0.0 Ventricular Hypertrophy
  • 5.0.0 ELECTROLYTE ABNORMALITIES, DRUG EFFECTS AND THE LONG QT SYNDROMES
  • 6.0.0 Ischemia and Infarction - Introduction (frame i and ii)
  • 7.0.0 Tachycardias- Introduction
  • 8.0.0 The Bradycardias frame i-introduction
  • 9.0.0 The ECG of Heart Murmurs-introduction
  • 10.0.0 The Electrocardiogram in the Emergency Department-Introduction
Powered by Drupal