Home
Understanding the Electrocardiogram

Main navigation

  • Home
  • Understanding ECGs
    • Introduction
User account menu
  • Log in

Breadcrumb

  1. Home
  2. Understanding the Electrocardiogram In Health & Disease
  3. 2.0.0 The Normal Electrocardiogram
  4. 2.5.0 T wave

2.5.10

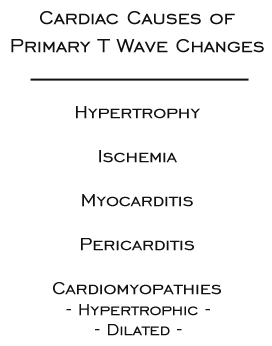
Primary T wave abnormalities are most often caused by a wide variety of cardiac diseases, some of which are shown here. 

Primary T wave changes may also be caused by electrolyte abnormalities, particularly changes in serum potassium and calcium and by drugs that alter the electrophysiologic properties of cardiac cells. i.e. cardioactive drugs. even in the absence of underlying cardiac disease.

Book traversal links for 2.5.10

  • 2.5.9
  • Up
  • 2.5.11

Site is under construction

Book navigation

  • Introduction to First Edition
  • 1.0.0 Generation of the ECG
  • 2.0.0 The Normal Electrocardiogram
    • 2.1.0 P Wave
    • 2.2.0 PR Interval
    • 2.3.0 QRS Complex
    • 2.4.0 ST segment
    • 2.5.0 T wave
      • 2.5.1
      • 2.5.2
      • 2.5.3
      • 2.5.4
      • 2.5.5
      • 2.5.6
      • 2.5.7
      • 2.5.8
      • 2.5.9
      • 2.5.10
      • 2.5.11
      • 2.5.12
      • 2.5.13
    • 2.6.0 QT Interval
    • 2.7.0 U Wave
  • 3.0.0 Inter and intra-ventricular Conduction Disturbances
  • 4.0.0 Ventricular Hypertrophy
  • 5.0.0 ELECTROLYTE ABNORMALITIES, DRUG EFFECTS AND THE LONG QT SYNDROMES
  • 6.0.0 Ischemia and Infarction - Introduction (frame i and ii)
  • 7.0.0 Tachycardias- Introduction
  • 8.0.0 The Bradycardias frame i-introduction
  • 9.0.0 The ECG of Heart Murmurs-introduction
  • 10.0.0 The Electrocardiogram in the Emergency Department-Introduction
Powered by Drupal