Home
Understanding the Electrocardiogram

Main navigation

  • Home
  • Understanding ECGs
    • Introduction
User account menu
  • Log in

Breadcrumb

  1. Home
  2. Understanding the Electrocardiogram In Health & Disease
  3. 2.0.0 The Normal Electrocardiogram
  4. 2.2.0 PR Interval

2.2.4

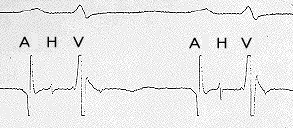
Electrical activity of the common His bundle can be recorded from an electrode catheter placed directly over it. The recording obtained in this manner, shown here in the lower tracing, is referred to as a His bundle electrogram. The upper tracing is the simultaneously recorded lead II electrocardiogram. The various deflections on the His Bundle electrogram represent atrial depolarization (A), depolarization of the common His bundle( H) and ventricular depolarization (V).

Book traversal links for 2.2.4

  • 2.2.3
  • Up
  • 2.2.5

Site is under construction

Book navigation

  • Introduction to First Edition
  • 1.0.0 Generation of the ECG
  • 2.0.0 The Normal Electrocardiogram
    • 2.1.0 P Wave
    • 2.2.0 PR Interval
      • 2.2.1
      • 2.2.2
      • 2.2.3
      • 2.2.4
      • 2.2.5
      • 2.2.6
      • 2.2.7
      • 2.2.8
      • 2.2.9
      • 2.2.10
    • 2.3.0 QRS Complex
    • 2.4.0 ST segment
    • 2.5.0 T wave
    • 2.6.0 QT Interval
    • 2.7.0 U Wave
  • 3.0.0 Inter and intra-ventricular Conduction Disturbances
  • 4.0.0 Ventricular Hypertrophy
  • 5.0.0 ELECTROLYTE ABNORMALITIES, DRUG EFFECTS AND THE LONG QT SYNDROMES
  • 6.0.0 Ischemia and Infarction - Introduction (frame i and ii)
  • 7.0.0 Tachycardias- Introduction
  • 8.0.0 The Bradycardias frame i-introduction
  • 9.0.0 The ECG of Heart Murmurs-introduction
  • 10.0.0 The Electrocardiogram in the Emergency Department-Introduction
Powered by Drupal