Home
Understanding the Electrocardiogram

Main navigation

  • Home
  • Understanding ECGs
    • Introduction
User account menu
  • Log in

Breadcrumb

  1. Home
  2. Understanding the Electrocardiogram In Health & Disease
  3. 2.0.0 The Normal Electrocardiogram
  4. 2.2.0 PR Interval

2.2.3

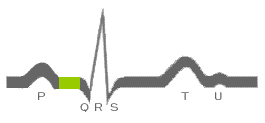
There is no wave form obvious on the body surface electrocardiogram during the interval from the end of the P wave to the onset of the QRS complex. This is eferred to as the PR segment and is  shown here in green. However, it iks important to recognize that during this interval, atrial cells are repolarizing and cells within the conduction system are depolarizing. The absence of any obvious deflection on the ECG is due to the recording characteristics of the ECG machine, such as its sampling rate, frequency response, and filter settings and the fact that the mass of tissue involved is on the endocardial surface and is relatively small.

Book traversal links for 2.2.3

  • 2.2.2
  • Up
  • 2.2.4

Site is under construction

Book navigation

  • Introduction to First Edition
  • 1.0.0 Generation of the ECG
  • 2.0.0 The Normal Electrocardiogram
    • 2.1.0 P Wave
    • 2.2.0 PR Interval
      • 2.2.1
      • 2.2.2
      • 2.2.3
      • 2.2.4
      • 2.2.5
      • 2.2.6
      • 2.2.7
      • 2.2.8
      • 2.2.9
      • 2.2.10
    • 2.3.0 QRS Complex
    • 2.4.0 ST segment
    • 2.5.0 T wave
    • 2.6.0 QT Interval
    • 2.7.0 U Wave
  • 3.0.0 Inter and intra-ventricular Conduction Disturbances
  • 4.0.0 Ventricular Hypertrophy
  • 5.0.0 ELECTROLYTE ABNORMALITIES, DRUG EFFECTS AND THE LONG QT SYNDROMES
  • 6.0.0 Ischemia and Infarction - Introduction (frame i and ii)
  • 7.0.0 Tachycardias- Introduction
  • 8.0.0 The Bradycardias frame i-introduction
  • 9.0.0 The ECG of Heart Murmurs-introduction
  • 10.0.0 The Electrocardiogram in the Emergency Department-Introduction
Powered by Drupal