Home
Understanding the Electrocardiogram

Main navigation

  • Home
  • Understanding ECGs
    • Introduction
User account menu
  • Log in

Breadcrumb

  1. Home
  2. Understanding the Electrocardiogram In Health & Disease
  3. 6.0.0 Ischemia and Infarction - Introduction (frame i and ii)
  4. 6.2.0 Q WAVES (frame 53)

6.2.13(71)

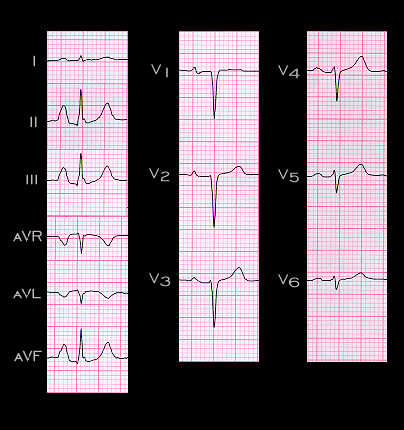
Another example of poor R wave progression is shown in this tracing from a 54 year old patient with severe chronic pulmonary disease but no clinical evidence of coronary disease. The tall P waves in leads II, III and aVF (P pulmonale}, vertical axis of the QRS complex in the frontal plane (+85 degrees) and poor R wave progression in the chest leads all reflect the chronic pulmonary disease.

Book traversal links for 6.2.13(71)

  • 6.2.12 (frame 70)
  • Up
  • 6.2.14 (72)

Site is under construction

Book navigation

  • Introduction to First Edition
  • 1.0.0 Generation of the ECG
  • 2.0.0 The Normal Electrocardiogram
  • 3.0.0 Inter and intra-ventricular Conduction Disturbances
  • 4.0.0 Ventricular Hypertrophy
  • 5.0.0 ELECTROLYTE ABNORMALITIES, DRUG EFFECTS AND THE LONG QT SYNDROMES
  • 6.0.0 Ischemia and Infarction - Introduction (frame i and ii)
    • 6.1.0 ST Segment (frame1)
    • 6.2.0 Q WAVES (frame 53)
      • 6.2.1 (54)
      • 6.2.2 (55)
      • 6.2.3 (56)
      • 6.2.4 (57)
      • 6.2.5 (58)
      • 6.2.6 (59)
      • 6.2.7
      • 6.2.8 (61)
      • 6.2.9 (64)
      • 6.2.10 (68)
      • 6.2.11 (69)
      • 6.2.12 (frame 70)
      • 6.2.13(71)
      • 6.2.14 (72)
      • 6.2.15 (73)
      • 6.2.16 (74)
    • 6.3.0 T WAVES (frame 75)
    • 6.4.0 (Bundle Branch Blocks and othe IVCDs--frame 87)
    • 6.5.0 (frame 106) FALSE POSITIVES
  • 7.0.0 Tachycardias- Introduction
  • 8.0.0 The Bradycardias frame i-introduction
  • 9.0.0 The ECG of Heart Murmurs-introduction
  • 10.0.0 The Electrocardiogram in the Emergency Department-Introduction
Powered by Drupal