Home
Understanding the Electrocardiogram

Main navigation

  • Home
  • Understanding ECGs
    • Introduction
User account menu
  • Log in

Breadcrumb

  1. Home
  2. Understanding the Electrocardiogram In Health & Disease
  3. 6.0.0 Ischemia and Infarction - Introduction (frame i and ii)
  4. 6.2.0 Q WAVES (frame 53)

6.2.5 (58)

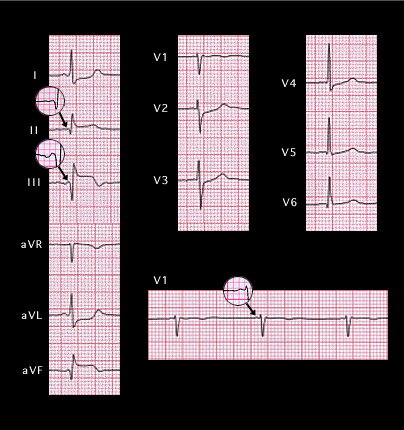
This ECG was also presented earlier (page 6.1.32). It is from the 54 year old women with an acute inferior wall infarction whose angiogram (page 6.1.33) showed an occlusion in the proximal portion of the right coronary artery. Before examining the QRS complex, note that the P wave-shown in the magnifying glass-is abnormal. It is isoelectric in lead II and inverted in lead III with a frontal plane axis of -35 degrees. It is also negative-positive (rather than the normal positive-negative) in V1 and the PR interval is abnormally short- less than 100ms. These abnormalities indicate an ectopic supraventricular rhythm, probably arising high in the AV node, and suggest that the occlusion might also have involved vessels to the sinus node and the right atrium.

The Q waves in 2, 3 and aVF indicate that the initial portion of the QRS complex is directed away from the inferior wall. Try to visualize its spatial  vector, as well as those of the mid and terminal portions of the QRS complex before going to the next page.

Book traversal links for 6.2.5 (58)

  • 6.2.4 (57)
  • Up
  • 6.2.6 (59)

Site is under construction

Book navigation

  • Introduction to First Edition
  • 1.0.0 Generation of the ECG
  • 2.0.0 The Normal Electrocardiogram
  • 3.0.0 Inter and intra-ventricular Conduction Disturbances
  • 4.0.0 Ventricular Hypertrophy
  • 5.0.0 ELECTROLYTE ABNORMALITIES, DRUG EFFECTS AND THE LONG QT SYNDROMES
  • 6.0.0 Ischemia and Infarction - Introduction (frame i and ii)
    • 6.1.0 ST Segment (frame1)
    • 6.2.0 Q WAVES (frame 53)
      • 6.2.1 (54)
      • 6.2.2 (55)
      • 6.2.3 (56)
      • 6.2.4 (57)
      • 6.2.5 (58)
      • 6.2.6 (59)
      • 6.2.7
      • 6.2.8 (61)
      • 6.2.9 (64)
      • 6.2.10 (68)
      • 6.2.11 (69)
      • 6.2.12 (frame 70)
      • 6.2.13(71)
      • 6.2.14 (72)
      • 6.2.15 (73)
      • 6.2.16 (74)
    • 6.3.0 T WAVES (frame 75)
    • 6.4.0 (Bundle Branch Blocks and othe IVCDs--frame 87)
    • 6.5.0 (frame 106) FALSE POSITIVES
  • 7.0.0 Tachycardias- Introduction
  • 8.0.0 The Bradycardias frame i-introduction
  • 9.0.0 The ECG of Heart Murmurs-introduction
  • 10.0.0 The Electrocardiogram in the Emergency Department-Introduction
Powered by Drupal