Home
Understanding the Electrocardiogram

Main navigation

  • Home
  • Understanding ECGs
    • Introduction
User account menu
  • Log in

Breadcrumb

  1. Home
  2. Understanding the Electrocardiogram In Health & Disease
  3. 6.0.0 Ischemia and Infarction - Introduction (frame i and ii)
  4. 6.2.0 Q WAVES (frame 53)

6.2.10 (68)

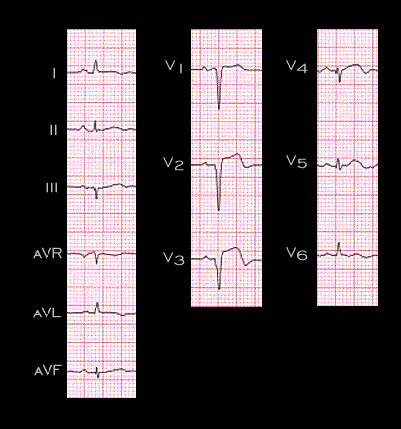
As indicated earlier, the presence of Q waves or QS complexes in leads V1, V2, and V3, as shown again in this tracing, permit the diagnosis of an infarction involving the interventricular septum and the anterior left ventricular wall with a reasonably high degree of accuracy. However, the interpretation of the ECG with QS complexes in only V1 and V2 or with a small R wave in leads V1-V4 is more difficult.

Book traversal links for 6.2.10 (68)

  • 6.2.9 (64)
  • Up
  • 6.2.11 (69)

Site is under construction

Book navigation

  • Introduction to First Edition
  • 1.0.0 Generation of the ECG
  • 2.0.0 The Normal Electrocardiogram
  • 3.0.0 Inter and intra-ventricular Conduction Disturbances
  • 4.0.0 Ventricular Hypertrophy
  • 5.0.0 ELECTROLYTE ABNORMALITIES, DRUG EFFECTS AND THE LONG QT SYNDROMES
  • 6.0.0 Ischemia and Infarction - Introduction (frame i and ii)
    • 6.1.0 ST Segment (frame1)
    • 6.2.0 Q WAVES (frame 53)
      • 6.2.1 (54)
      • 6.2.2 (55)
      • 6.2.3 (56)
      • 6.2.4 (57)
      • 6.2.5 (58)
      • 6.2.6 (59)
      • 6.2.7
      • 6.2.8 (61)
      • 6.2.9 (64)
      • 6.2.10 (68)
      • 6.2.11 (69)
      • 6.2.12 (frame 70)
      • 6.2.13(71)
      • 6.2.14 (72)
      • 6.2.15 (73)
      • 6.2.16 (74)
    • 6.3.0 T WAVES (frame 75)
    • 6.4.0 (Bundle Branch Blocks and othe IVCDs--frame 87)
    • 6.5.0 (frame 106) FALSE POSITIVES
  • 7.0.0 Tachycardias- Introduction
  • 8.0.0 The Bradycardias frame i-introduction
  • 9.0.0 The ECG of Heart Murmurs-introduction
  • 10.0.0 The Electrocardiogram in the Emergency Department-Introduction
Powered by Drupal