Home
Understanding the Electrocardiogram

Main navigation

  • Home
  • Understanding ECGs
    • Introduction
User account menu
  • Log in

Breadcrumb

  1. Home
  2. Understanding the Electrocardiogram In Health & Disease
  3. 6.0.0 Ischemia and Infarction - Introduction (frame i and ii)
  4. 6.2.0 Q WAVES (frame 53)

6.2.4 (57)

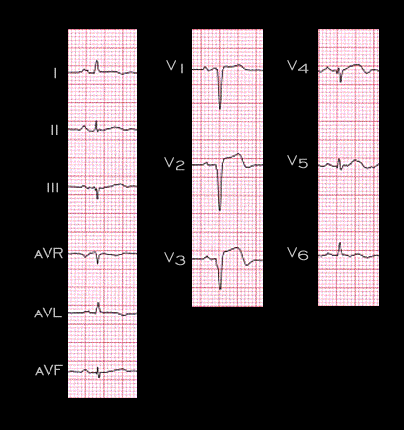
The ECG shown here was shown previously (see page 6.1.6). It is from the 74 year old woman with an acute myocardial infarction that was caused by occlusion of her left anterior descending coronary artery. The QS complexes in leads V1, V2 and V3 permit localization of the infarction to the interventricular septum and anterior wall of the left ventricle.

Book traversal links for 6.2.4 (57)

  • 6.2.3 (56)
  • Up
  • 6.2.5 (58)

Site is under construction

Book navigation

  • Introduction to First Edition
  • 1.0.0 Generation of the ECG
  • 2.0.0 The Normal Electrocardiogram
  • 3.0.0 Inter and intra-ventricular Conduction Disturbances
  • 4.0.0 Ventricular Hypertrophy
  • 5.0.0 ELECTROLYTE ABNORMALITIES, DRUG EFFECTS AND THE LONG QT SYNDROMES
  • 6.0.0 Ischemia and Infarction - Introduction (frame i and ii)
    • 6.1.0 ST Segment (frame1)
    • 6.2.0 Q WAVES (frame 53)
      • 6.2.1 (54)
      • 6.2.2 (55)
      • 6.2.3 (56)
      • 6.2.4 (57)
      • 6.2.5 (58)
      • 6.2.6 (59)
      • 6.2.7
      • 6.2.8 (61)
      • 6.2.9 (64)
      • 6.2.10 (68)
      • 6.2.11 (69)
      • 6.2.12 (frame 70)
      • 6.2.13(71)
      • 6.2.14 (72)
      • 6.2.15 (73)
      • 6.2.16 (74)
    • 6.3.0 T WAVES (frame 75)
    • 6.4.0 (Bundle Branch Blocks and othe IVCDs--frame 87)
    • 6.5.0 (frame 106) FALSE POSITIVES
  • 7.0.0 Tachycardias- Introduction
  • 8.0.0 The Bradycardias frame i-introduction
  • 9.0.0 The ECG of Heart Murmurs-introduction
  • 10.0.0 The Electrocardiogram in the Emergency Department-Introduction
Powered by Drupal