
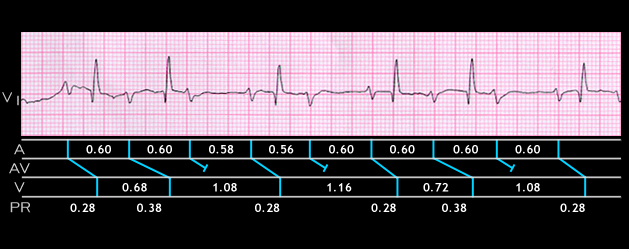
The tracing and ladder diagram displayed here demonstrate alternating 3:2 and 2:1 AV block. The diagnosis is relatively straight forward because of the changing PR intervals and the presence of non-conducted P waves during the pauses. The PP intervals range between 0.56 and 0.68 seconds. There is 3:2 AV block in the first group with an increase in the PR interval from 0.28 to 0.38 seconds prior to the blocked P wave. The duration of the pause surrounding the blocked P wave (1.08 seconds) is less than twice the preceding RR interval (2 x 0.68 = 1.36 seconds). There is then 2:1 AV block with an obvious P wave during the pause. This is followed by another group of 3:2 AV conduction. Note the differences in the duration of the pauses following the 3:2 and 2:1 blocks. The pause associated with the 2:1 block is longer than that associated with the 3:2 block. This reflects the prolongation of the PR interval prior to the blocked P wave when there is 3:2 block.