
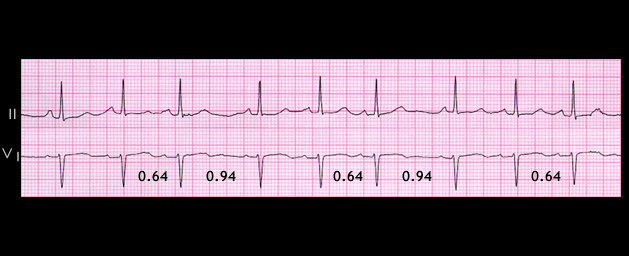
An example of 4:3 SA block is shown here. However, this tracing could also be interpreted as sinus arrhythmia.
Note that the interval between the groups of 3 shown in the example (0.94seconds) is less than twice the interval between the last two complexes of each group (2 x 0.64 = 1.28 seconds), again suggesting type I block with Wenckebach periodicity. The constant PR interval and the absence of P waves during the pause between the groups indicate the presence of SA rather than AV block. Before going to the next page, try to determine the sinus node discharge rate. Then construct the sino-atrial ladder diagram, similar to that shown on the previous page, to demonstrate the relationship between the sinus node impulses and the P waves.